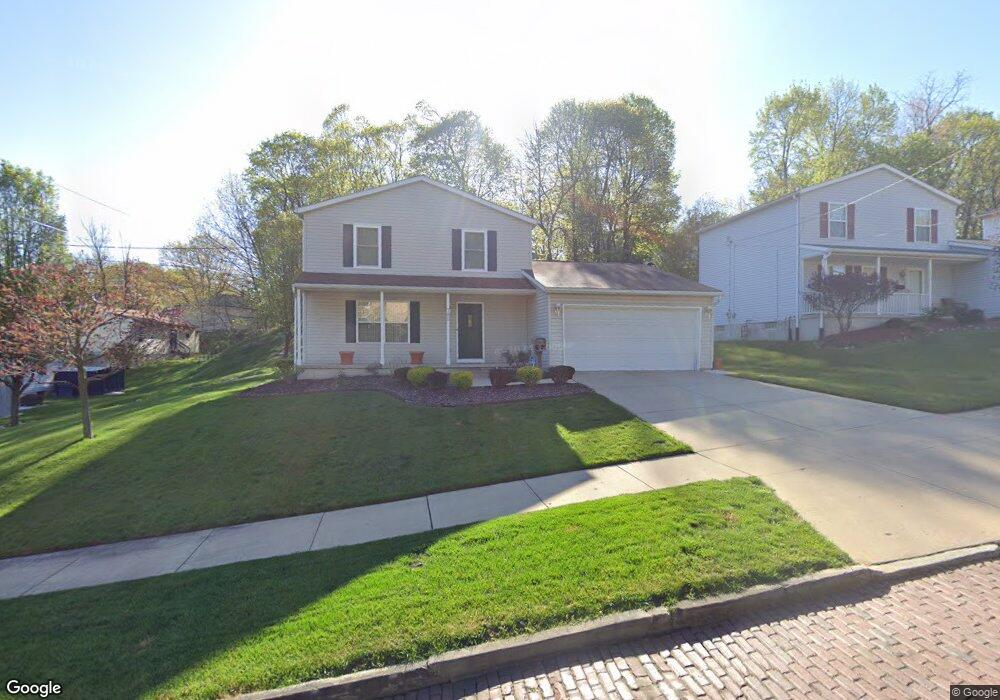
785 Springdale Dr Akron, OH 44310
North Hill NeighborhoodEstimated Value: $116,000 - $149,000
3
Beds
2
Baths
1,476
Sq Ft
$86/Sq Ft
Est. Value
About This Home
This home is located at 785 Springdale Dr, Akron, OH 44310 and is currently estimated at $126,540, approximately $85 per square foot. 785 Springdale Dr is a home located in Summit County with nearby schools including Findley Community Learning Center, North High School, and St. Vincent Elementary School.
Ownership History
Date
Name
Owned For
Owner Type
Purchase Details
Closed on
May 6, 2010
Sold by
Long Donald L
Bought by
Long Donald L
Current Estimated Value
Home Financials for this Owner
Home Financials are based on the most recent Mortgage that was taken out on this home.
Original Mortgage
$70,708
Outstanding Balance
$43,659
Interest Rate
3.5%
Mortgage Type
VA
Estimated Equity
$82,881
Purchase Details
Closed on
Mar 15, 2001
Sold by
Urban Neighborhood Development Corp
Bought by
Long Donald L
Home Financials for this Owner
Home Financials are based on the most recent Mortgage that was taken out on this home.
Original Mortgage
$73,950
Interest Rate
7.03%
Mortgage Type
VA
Purchase Details
Closed on
Mar 7, 2000
Sold by
Urban Neighborhood Development Corp
Bought by
Urban Neighborhood Development Corp
Purchase Details
Closed on
Aug 31, 1998
Sold by
Clupper Robert J
Bought by
Urban Neighborhood Dev Corp
Create a Home Valuation Report for This Property
The Home Valuation Report is an in-depth analysis detailing your home's value as well as a comparison with similar homes in the area
Home Values in the Area
Average Home Value in this Area
Purchase History
| Date | Buyer | Sale Price | Title Company |
|---|---|---|---|
| Long Donald L | -- | National Title Network | |
| Long Donald L | $73,950 | Endress/Lawyers Title | |
| Urban Neighborhood Development Corp | -- | Endress/Lawyers Title | |
| Urban Neighborhood Dev Corp | $2,000 | -- |
Source: Public Records
Mortgage History
| Date | Status | Borrower | Loan Amount |
|---|---|---|---|
| Open | Long Donald L | $70,708 | |
| Previous Owner | Long Donald L | $73,950 |
Source: Public Records
Tax History
| Year | Tax Paid | Tax Assessment Tax Assessment Total Assessment is a certain percentage of the fair market value that is determined by local assessors to be the total taxable value of land and additions on the property. | Land | Improvement |
|---|---|---|---|---|
| 2024 | $1,755 | $31,843 | $7,259 | $24,584 |
| 2023 | $1,755 | $31,843 | $7,259 | $24,584 |
| 2022 | $1,345 | $18,732 | $4,270 | $14,462 |
| 2021 | $1,346 | $18,732 | $4,270 | $14,462 |
| 2020 | $1,327 | $18,730 | $4,270 | $14,460 |
| 2019 | $1,819 | $23,980 | $6,170 | $17,810 |
| 2018 | $1,795 | $23,980 | $6,170 | $17,810 |
| 2017 | $1,823 | $23,980 | $6,170 | $17,810 |
| 2016 | $1,824 | $23,980 | $6,170 | $17,810 |
| 2015 | $1,823 | $23,980 | $6,170 | $17,810 |
| 2014 | $1,808 | $23,980 | $6,170 | $17,810 |
| 2013 | $1,889 | $25,670 | $6,170 | $19,500 |
Source: Public Records
Map
Nearby Homes
- 0 Garfield St
- 22 Uhler Ave
- 425 Spaulding St
- 77 W Mildred Ave
- 13 Alfaretta Ave
- 444 Evers St
- 74 Vesper St
- 49 W Salome Ave
- 28 W Salome Ave
- 897 Avon St
- 868 N Main St
- 594 Blaine Ave
- 405 Nob Hill Dr
- 32 Penfield Ave
- 810 Thayer St
- 793 Thayer St
- 670 Thayer St
- 481 Letchworth Dr
- 688 Dayton St
- 967 Oakland Ave Unit 969
- 779 Springdale Dr
- 170 Uhler Ave
- 782 Garfield St
- 160 Uhler Ave
- 773 Springdale Dr
- 778 Garfield St
- 776 Garfield St
- 768 Garfield St
- 786 Springdale Dr
- 780 Springdale Dr
- 156 Uhler Ave
- 765 Springdale Dr
- 766 Garfield St
- 776 Springdale Dr
- 796 Springdale Dr
- 796 Springdale Dr
- 764 Garfield St
- 163 Uhler Ave
- 770 Springdale Dr
- 844 Garfield St
Your Personal Tour Guide
Ask me questions while you tour the home.