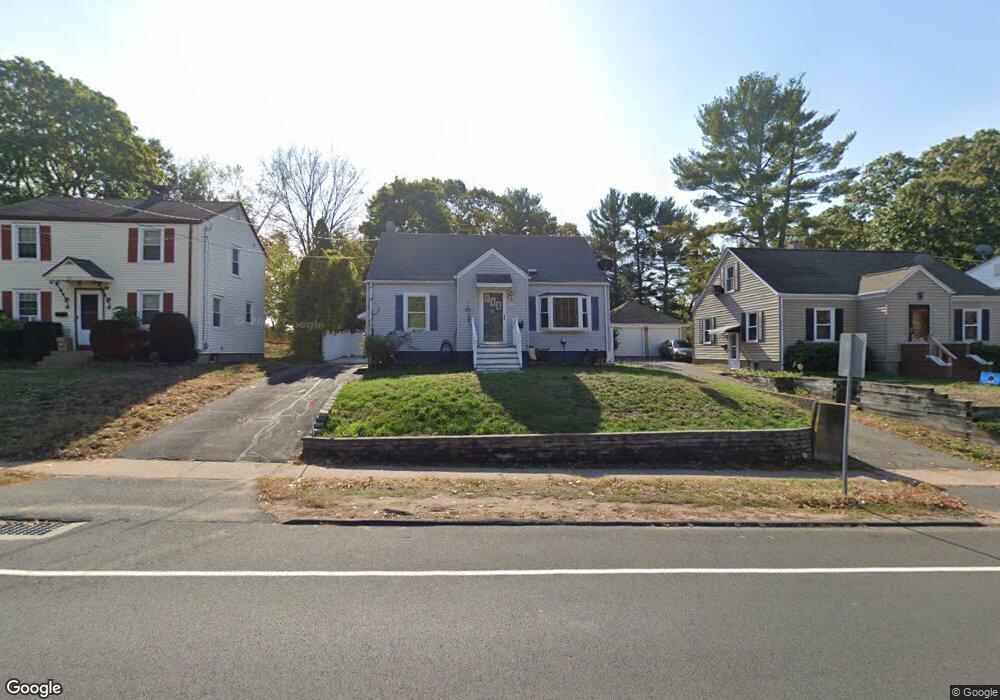
785 Tolland St East Hartford, CT 06108
Estimated Value: $299,000 - $310,019
2
Beds
3
Baths
1,450
Sq Ft
$211/Sq Ft
Est. Value
About This Home
This home is located at 785 Tolland St, East Hartford, CT 06108 and is currently estimated at $306,505, approximately $211 per square foot. 785 Tolland St is a home located in Hartford County with nearby schools including Dr. Franklin H. Mayberry School, East Hartford Middle School, and East Hartford High School.
Ownership History
Date
Name
Owned For
Owner Type
Purchase Details
Closed on
Mar 12, 2001
Sold by
Iwanicki Michael H and Iwanicki Kathleen W
Bought by
Rivera Linda
Current Estimated Value
Home Financials for this Owner
Home Financials are based on the most recent Mortgage that was taken out on this home.
Original Mortgage
$86,400
Interest Rate
7.15%
Purchase Details
Closed on
Apr 30, 1993
Sold by
White Margaret S
Bought by
Iwanicki Michael H and Iwanicki Kathleen W
Home Financials for this Owner
Home Financials are based on the most recent Mortgage that was taken out on this home.
Original Mortgage
$87,400
Interest Rate
7.51%
Mortgage Type
Unknown
Create a Home Valuation Report for This Property
The Home Valuation Report is an in-depth analysis detailing your home's value as well as a comparison with similar homes in the area
Home Values in the Area
Average Home Value in this Area
Purchase History
| Date | Buyer | Sale Price | Title Company |
|---|---|---|---|
| Rivera Linda | $108,000 | -- | |
| Iwanicki Michael H | $92,000 | -- |
Source: Public Records
Mortgage History
| Date | Status | Borrower | Loan Amount |
|---|---|---|---|
| Open | Iwanicki Michael H | $104,500 | |
| Closed | Iwanicki Michael H | $86,400 | |
| Previous Owner | Iwanicki Michael H | $87,400 |
Source: Public Records
Tax History Compared to Growth
Tax History
| Year | Tax Paid | Tax Assessment Tax Assessment Total Assessment is a certain percentage of the fair market value that is determined by local assessors to be the total taxable value of land and additions on the property. | Land | Improvement |
|---|---|---|---|---|
| 2025 | $6,741 | $146,860 | $45,560 | $101,300 |
| 2024 | $6,462 | $146,860 | $45,560 | $101,300 |
| 2023 | $6,247 | $146,860 | $45,560 | $101,300 |
| 2022 | $6,021 | $146,860 | $45,560 | $101,300 |
| 2021 | $4,999 | $101,300 | $27,940 | $73,360 |
| 2020 | $5,057 | $101,300 | $27,940 | $73,360 |
| 2019 | $4,975 | $101,300 | $27,940 | $73,360 |
| 2018 | $4,828 | $101,300 | $27,940 | $73,360 |
| 2017 | $4,766 | $101,300 | $27,940 | $73,360 |
| 2016 | $4,756 | $103,710 | $27,940 | $75,770 |
| 2015 | $4,756 | $103,710 | $27,940 | $75,770 |
| 2014 | $4,708 | $103,710 | $27,940 | $75,770 |
Source: Public Records
Map
Nearby Homes
- 26 Casabella Cir Unit 28
- 8 Howard Ct Unit 10
- 73 Bliss St
- 0 Hillside Ave
- 40 Larrabee St
- 59 Laraia Ave
- 952 Tolland St
- 61 Leverich Dr
- 47 Bodwell Rd
- 53 Arbutus St
- 577 Goodwin St
- 1220 Burnside Ave Unit A
- 421 Tolland St
- 22 Matthew Rd
- 7 Colgate Ln
- 89 Henderson Dr
- 13-15 Burnside Ave
- 15 Christine Dr
- 15 Michael Ave
- 95 Arnold Dr
- 791 Tolland St
- 781 Tolland St
- 797 Tolland St
- 777 Tolland St
- 775 Tolland St
- 801 Tolland St
- 790 Tolland St
- 784 Tolland St
- 805 Tolland St
- 763 Tolland St
- 166 Larrabee St
- 162 Larrabee St
- 800 Tolland St
- 759 Tolland St
- 806 Tolland St
- 173 Larrabee St
- 751 Tolland St
- 206 Larrabee St
- 211 Larrabee St
- 9 Casabella Cir