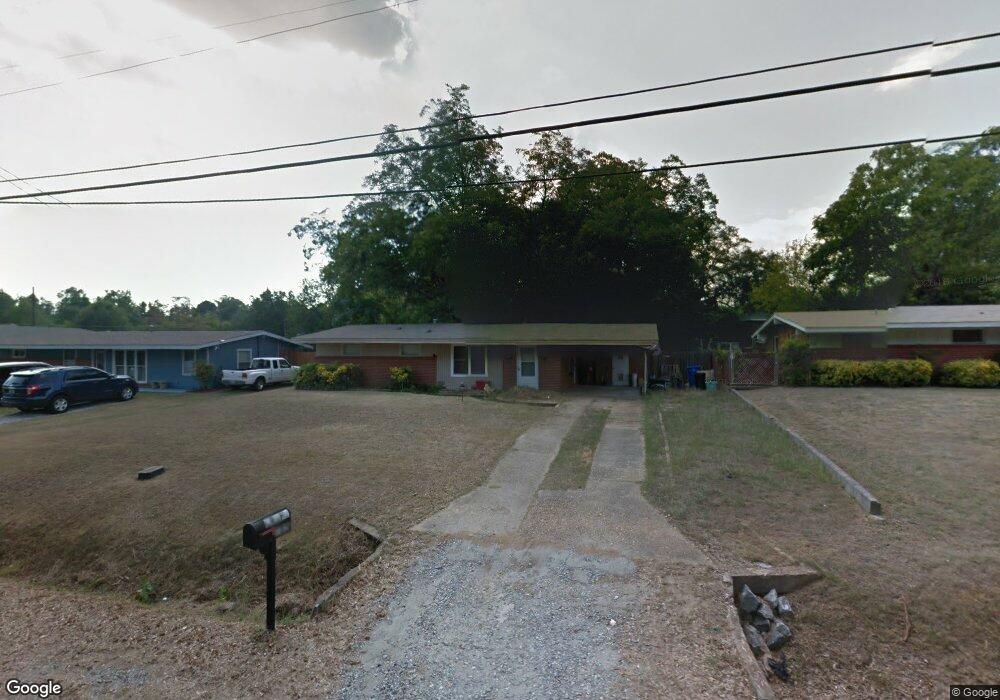
785 Turner Rd Columbus, GA 31904
Northern Columbus NeighborhoodEstimated Value: $150,092 - $170,000
3
Beds
2
Baths
1,558
Sq Ft
$103/Sq Ft
Est. Value
About This Home
This home is located at 785 Turner Rd, Columbus, GA 31904 and is currently estimated at $159,773, approximately $102 per square foot. 785 Turner Rd is a home located in Muscogee County with nearby schools including River Road Elementary School, Arnold Middle School, and Jordan Vocational High School.
Ownership History
Date
Name
Owned For
Owner Type
Purchase Details
Closed on
Dec 26, 2018
Sold by
Real Estate Investments Done Wright Llc
Bought by
Jones Travis E
Current Estimated Value
Home Financials for this Owner
Home Financials are based on the most recent Mortgage that was taken out on this home.
Original Mortgage
$95,232
Outstanding Balance
$84,985
Interest Rate
5.37%
Mortgage Type
FHA
Estimated Equity
$74,788
Purchase Details
Closed on
Feb 6, 2018
Sold by
Craft Christopher S
Bought by
Real Estate Investments Done W
Purchase Details
Closed on
Dec 11, 2009
Sold by
Morequity Inc
Bought by
Craft Christopher Scott and Craft Debra L
Home Financials for this Owner
Home Financials are based on the most recent Mortgage that was taken out on this home.
Original Mortgage
$92,499
Interest Rate
5.5%
Mortgage Type
FHA
Purchase Details
Closed on
Apr 7, 2009
Sold by
Mccathern William B and Mccathern Geneva Elaine
Bought by
Morequity Inc
Create a Home Valuation Report for This Property
The Home Valuation Report is an in-depth analysis detailing your home's value as well as a comparison with similar homes in the area
Home Values in the Area
Average Home Value in this Area
Purchase History
| Date | Buyer | Sale Price | Title Company |
|---|---|---|---|
| Jones Travis E | $104,900 | -- | |
| Real Estate Investments Done W | $46,201 | -- | |
| Craft Christopher Scott | $67,500 | None Available | |
| Morequity Inc | $75,000 | None Available |
Source: Public Records
Mortgage History
| Date | Status | Borrower | Loan Amount |
|---|---|---|---|
| Open | Jones Travis E | $95,232 | |
| Previous Owner | Craft Christopher Scott | $92,499 |
Source: Public Records
Tax History Compared to Growth
Tax History
| Year | Tax Paid | Tax Assessment Tax Assessment Total Assessment is a certain percentage of the fair market value that is determined by local assessors to be the total taxable value of land and additions on the property. | Land | Improvement |
|---|---|---|---|---|
| 2025 | $858 | $45,096 | $9,476 | $35,620 |
| 2024 | $857 | $45,096 | $9,476 | $35,620 |
| 2023 | $168 | $45,096 | $9,476 | $35,620 |
| 2022 | $894 | $32,424 | $7,108 | $25,316 |
| 2021 | $887 | $35,112 | $7,108 | $28,004 |
| 2020 | $887 | $35,112 | $7,108 | $28,004 |
| 2019 | $892 | $35,112 | $7,108 | $28,004 |
| 2018 | $655 | $35,400 | $7,108 | $28,292 |
| 2017 | $659 | $35,400 | $7,108 | $28,292 |
| 2016 | $663 | $29,337 | $2,850 | $26,487 |
| 2015 | $664 | $29,337 | $2,850 | $26,487 |
| 2014 | $665 | $29,337 | $2,850 | $26,487 |
| 2013 | -- | $29,337 | $2,850 | $26,487 |
Source: Public Records
Map
Nearby Homes