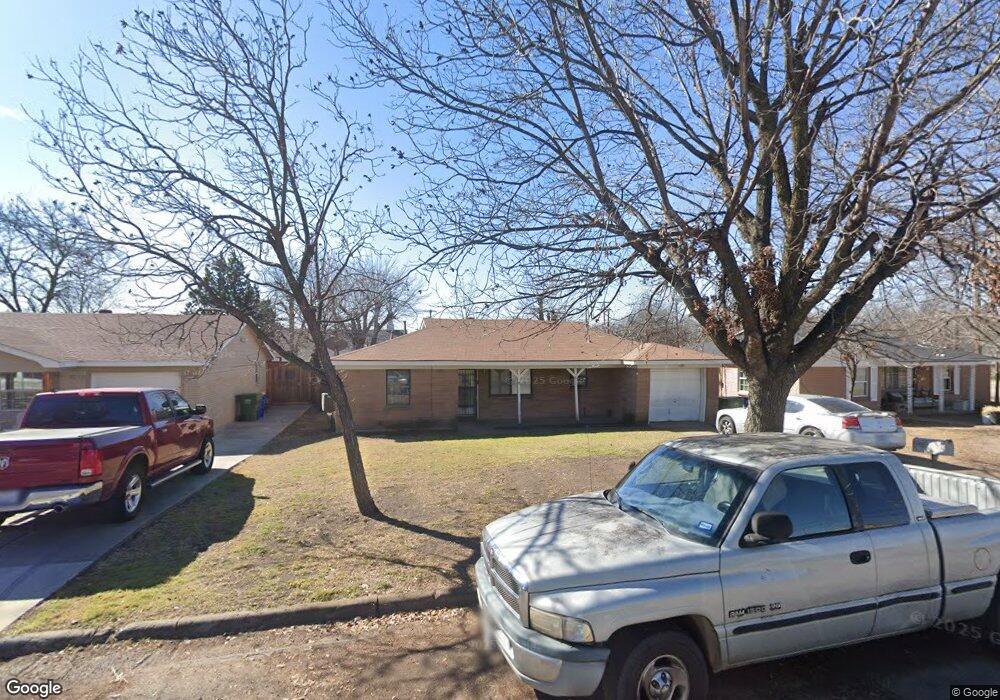
7853 Abbott Dr Fort Worth, TX 76108
Estimated Value: $232,000 - $259,000
3
Beds
2
Baths
1,790
Sq Ft
$138/Sq Ft
Est. Value
About This Home
This home is located at 7853 Abbott Dr, Fort Worth, TX 76108 and is currently estimated at $247,790, approximately $138 per square foot. 7853 Abbott Dr is a home located in Tarrant County with nearby schools including Liberty Elementary School, Brewer Middle School, and Tannahill Intermediate School.
Ownership History
Date
Name
Owned For
Owner Type
Purchase Details
Closed on
Nov 14, 2008
Sold by
Currie Carolyn J
Bought by
Valverde Horacio and Valverde Fatima
Current Estimated Value
Home Financials for this Owner
Home Financials are based on the most recent Mortgage that was taken out on this home.
Original Mortgage
$59,600
Interest Rate
6.18%
Mortgage Type
Seller Take Back
Purchase Details
Closed on
Dec 30, 1996
Sold by
Powers Thomas Edward and Powers Ann Olene
Bought by
Currie Carolyn J
Home Financials for this Owner
Home Financials are based on the most recent Mortgage that was taken out on this home.
Original Mortgage
$50,971
Interest Rate
7.54%
Create a Home Valuation Report for This Property
The Home Valuation Report is an in-depth analysis detailing your home's value as well as a comparison with similar homes in the area
Home Values in the Area
Average Home Value in this Area
Purchase History
| Date | Buyer | Sale Price | Title Company |
|---|---|---|---|
| Valverde Horacio | -- | None Available | |
| Currie Carolyn J | -- | Trinity Western Title Co |
Source: Public Records
Mortgage History
| Date | Status | Borrower | Loan Amount |
|---|---|---|---|
| Closed | Valverde Horacio | $59,600 | |
| Previous Owner | Currie Carolyn J | $50,971 |
Source: Public Records
Tax History Compared to Growth
Tax History
| Year | Tax Paid | Tax Assessment Tax Assessment Total Assessment is a certain percentage of the fair market value that is determined by local assessors to be the total taxable value of land and additions on the property. | Land | Improvement |
|---|---|---|---|---|
| 2025 | $5,953 | $251,274 | $45,430 | $205,844 |
| 2024 | $5,953 | $251,274 | $45,430 | $205,844 |
| 2023 | $5,999 | $252,296 | $45,430 | $206,866 |
| 2022 | $5,661 | $209,053 | $25,000 | $184,053 |
| 2021 | $5,367 | $195,098 | $25,000 | $170,098 |
| 2020 | $4,699 | $169,587 | $25,000 | $144,587 |
| 2019 | $4,945 | $171,905 | $25,000 | $146,905 |
| 2018 | $3,995 | $138,885 | $12,000 | $126,885 |
| 2017 | $4,008 | $137,149 | $12,000 | $125,149 |
| 2016 | $2,490 | $85,206 | $12,000 | $73,206 |
| 2015 | $2,280 | $79,400 | $9,000 | $70,400 |
| 2014 | $2,280 | $79,400 | $9,000 | $70,400 |
Source: Public Records
Map
Nearby Homes