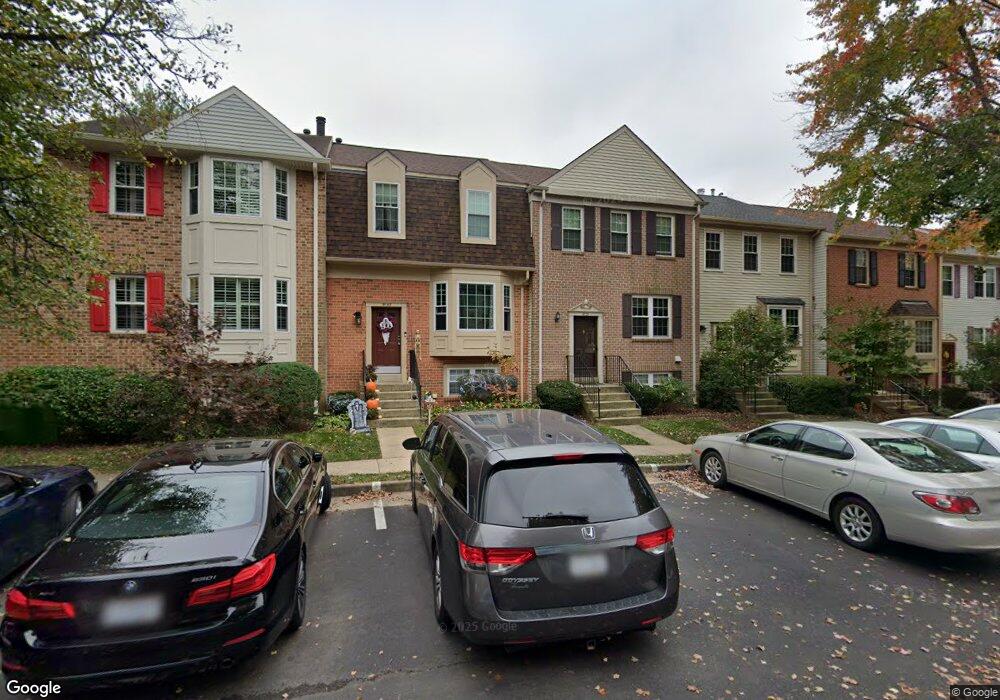
7853 Colonial Village Row Annandale, VA 22003
Estimated Value: $650,000 - $675,000
4
Beds
4
Baths
2,000
Sq Ft
$331/Sq Ft
Est. Value
About This Home
This home is located at 7853 Colonial Village Row, Annandale, VA 22003 and is currently estimated at $662,495, approximately $331 per square foot. 7853 Colonial Village Row is a home located in Fairfax County with nearby schools including Woodburn Elementary School, Luther Jackson Middle School, and Falls Church High School.
Ownership History
Date
Name
Owned For
Owner Type
Purchase Details
Closed on
Mar 31, 2011
Sold by
Cooley David B
Bought by
Nacios Kevin P
Current Estimated Value
Home Financials for this Owner
Home Financials are based on the most recent Mortgage that was taken out on this home.
Original Mortgage
$368,125
Outstanding Balance
$256,803
Interest Rate
5.04%
Mortgage Type
New Conventional
Estimated Equity
$405,692
Purchase Details
Closed on
Mar 26, 2003
Sold by
Edwards Deborah L
Bought by
Cooley David B
Home Financials for this Owner
Home Financials are based on the most recent Mortgage that was taken out on this home.
Original Mortgage
$228,000
Interest Rate
5.91%
Mortgage Type
New Conventional
Purchase Details
Closed on
Jun 25, 1999
Sold by
Russo David J
Bought by
Edwards Deborah L and Salisbury,Mark D
Home Financials for this Owner
Home Financials are based on the most recent Mortgage that was taken out on this home.
Original Mortgage
$146,400
Interest Rate
7.09%
Create a Home Valuation Report for This Property
The Home Valuation Report is an in-depth analysis detailing your home's value as well as a comparison with similar homes in the area
Home Values in the Area
Average Home Value in this Area
Purchase History
| Date | Buyer | Sale Price | Title Company |
|---|---|---|---|
| Nacios Kevin P | $387,500 | -- | |
| Cooley David B | $285,000 | -- | |
| Edwards Deborah L | $183,000 | -- |
Source: Public Records
Mortgage History
| Date | Status | Borrower | Loan Amount |
|---|---|---|---|
| Open | Nacios Kevin P | $368,125 | |
| Previous Owner | Cooley David B | $228,000 | |
| Previous Owner | Edwards Deborah L | $146,400 |
Source: Public Records
Tax History Compared to Growth
Tax History
| Year | Tax Paid | Tax Assessment Tax Assessment Total Assessment is a certain percentage of the fair market value that is determined by local assessors to be the total taxable value of land and additions on the property. | Land | Improvement |
|---|---|---|---|---|
| 2025 | $6,383 | $594,510 | $195,000 | $399,510 |
| 2024 | $6,383 | $550,980 | $180,000 | $370,980 |
| 2023 | $6,036 | $534,850 | $175,000 | $359,850 |
| 2022 | $5,674 | $496,180 | $160,000 | $336,180 |
| 2021 | $5,449 | $464,370 | $155,000 | $309,370 |
| 2020 | $5,130 | $433,440 | $150,000 | $283,440 |
| 2019 | $5,011 | $423,440 | $140,000 | $283,440 |
| 2018 | $4,870 | $423,440 | $140,000 | $283,440 |
| 2017 | $4,673 | $402,540 | $130,000 | $272,540 |
| 2016 | $4,663 | $402,540 | $130,000 | $272,540 |
| 2015 | $4,492 | $402,540 | $130,000 | $272,540 |
| 2014 | $4,343 | $390,030 | $130,000 | $260,030 |
Source: Public Records
Map
Nearby Homes
- 7852 Newport Glen Pass
- 7850 Butterfield Ln
- 7804 Byrds Nest Pass
- 7825 Butterfield Ln
- 7801 Byrds Nest Pass
- 7930 Peyton Forest Trail
- 7836 Ashley Glen Rd
- 3478 Pence Ct
- 4009 Estabrook Dr
- 0 Annandale Unit VAFX2223824
- 7801 Ridgewood Dr
- 3905 Hummer Rd
- 7530 Royce Ct
- 7814 Wendy Ridge Ln
- 7551 Marshall Dr
- 7808 Wendy Ridge Ln
- 3502 Holly Rd
- 3436 Holly Rd
- 3507 Gallows Rd
- 4017 Woodland Rd
- 7855 Colonial Village Row
- 7851 Colonial Village Row
- 7857 Colonial Village Row
- 7859 Colonial Village Row
- 7861 Colonial Village Row
- 7863 Colonial Village Row
- 7865 Colonial Village Row
- 7854 Newport Glen Pass
- 7856 Newport Glen Pass
- 7850 Newport Glen Pass
- 7854 Colonial Village Row
- 7852 Colonial Village Row
- 7856 Colonial Village Row
- 7858 Newport Glen Pass
- 7858 Colonial Village Row
- 7850 Colonial Village Row
- 7860 Newport Glen Pass
- 7860 Colonial Village Row
- 7838 Byrds Nest Pass
- 7862 Newport Glen Pass