Estimated Value: $417,461 - $481,000
--
Bed
2
Baths
2,254
Sq Ft
$206/Sq Ft
Est. Value
About This Home
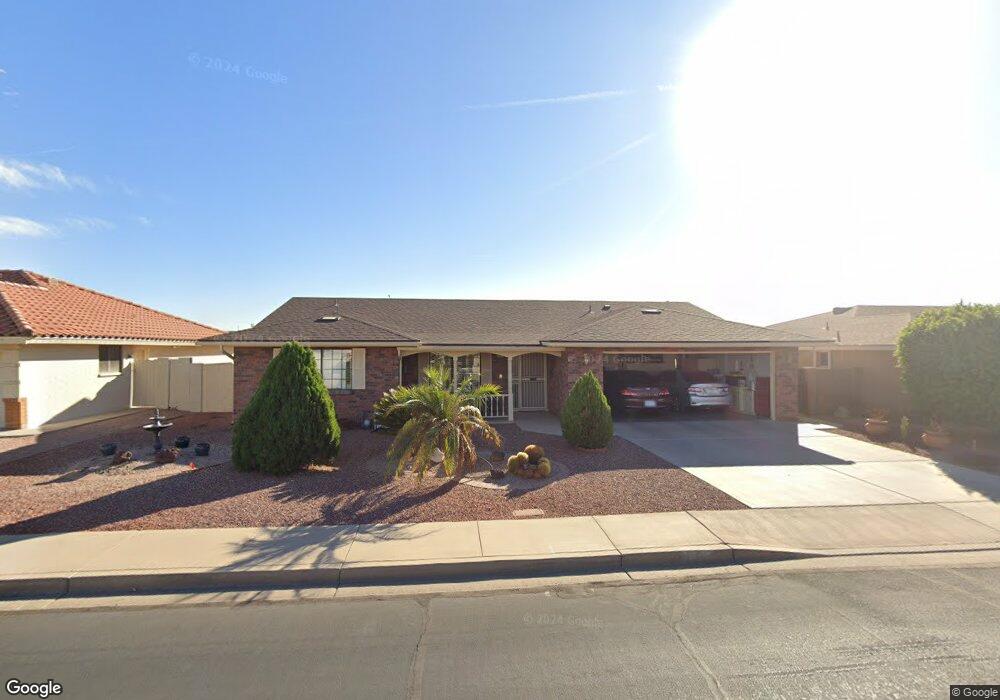
This home is located at 7853 E Neville Ave, Mesa, AZ 85209 and is currently estimated at $463,865, approximately $205 per square foot. 7853 E Neville Ave is a home located in Maricopa County with nearby schools including Boulder Creek Elementary School, Desert Ridge Jr. High School, and Desert Ridge High School.
Ownership History
Date
Name
Owned For
Owner Type
Purchase Details
Closed on
Nov 23, 2016
Sold by
Johnson Margarita R and Johnson Robert E
Bought by
Reynoso Elodiw Gonzalez
Current Estimated Value
Purchase Details
Closed on
Jun 4, 2001
Sold by
Farley Harold J and Farley Patricia L
Bought by
Johnson Robert E and Johnson Margarita R
Home Financials for this Owner
Home Financials are based on the most recent Mortgage that was taken out on this home.
Original Mortgage
$48,000
Interest Rate
7.21%
Mortgage Type
Seller Take Back
Purchase Details
Closed on
Nov 13, 1998
Sold by
Hall Walter S and Hall Glenna M
Bought by
Farley Harold J and Farley Patricia L
Purchase Details
Closed on
Aug 11, 1995
Sold by
Transamerica Title Insurance Company
Bought by
Hall Walter S and Hall Glenna M
Home Financials for this Owner
Home Financials are based on the most recent Mortgage that was taken out on this home.
Original Mortgage
$100,000
Interest Rate
5.75%
Mortgage Type
New Conventional
Create a Home Valuation Report for This Property
The Home Valuation Report is an in-depth analysis detailing your home's value as well as a comparison with similar homes in the area
Home Values in the Area
Average Home Value in this Area
Purchase History
| Date | Buyer | Sale Price | Title Company |
|---|---|---|---|
| Reynoso Elodiw Gonzalez | -- | None Available | |
| Johnson Robert E | $168,000 | Transnation Title Insurance | |
| Farley Harold J | $169,000 | Transnation Title Ins Co | |
| Hall Walter S | $139,960 | Transamerica Title Ins Co |
Source: Public Records
Mortgage History
| Date | Status | Borrower | Loan Amount |
|---|---|---|---|
| Previous Owner | Johnson Robert E | $48,000 | |
| Previous Owner | Hall Walter S | $100,000 |
Source: Public Records
Tax History Compared to Growth
Tax History
| Year | Tax Paid | Tax Assessment Tax Assessment Total Assessment is a certain percentage of the fair market value that is determined by local assessors to be the total taxable value of land and additions on the property. | Land | Improvement |
|---|---|---|---|---|
| 2025 | $2,000 | $27,003 | -- | -- |
| 2024 | $1,941 | $25,717 | -- | -- |
| 2023 | $1,941 | $32,160 | $6,430 | $25,730 |
| 2022 | $1,893 | $27,550 | $5,510 | $22,040 |
| 2021 | $2,051 | $25,480 | $5,090 | $20,390 |
| 2020 | $2,015 | $21,410 | $4,280 | $17,130 |
| 2019 | $1,867 | $20,150 | $4,030 | $16,120 |
| 2018 | $1,797 | $19,400 | $3,880 | $15,520 |
| 2017 | $1,743 | $19,120 | $3,820 | $15,300 |
| 2016 | $1,807 | $17,930 | $3,580 | $14,350 |
| 2015 | $1,657 | $17,580 | $3,510 | $14,070 |
Source: Public Records
Map
Nearby Homes
- 7866 E Neville Ave
- 7842 E Navarro Ave
- 7920 E Navarro Ave
- 7927 E Natal Ave
- 7918 E Nido Ave
- 7811 E Navarro Ave
- 7925 E Monte Ave
- 7937 E Monte Ave
- 7941 E Navarro Ave
- 2636 S Honeysuckle Cir
- 7953 E Milagro Ave
- 7832 E Osage Ave
- 7925 E Osage Ave
- 7859 E Madero Ave
- 7849 E Madero Ave
- 7755 E Laguna Azul Ave Unit 147
- 7755 E Laguna Azul Ave Unit 184
- 8041 E Meseto Ave
- 8065 E Madero Ave
- 7829 E Plata Ave
- 7847 E Neville Ave
- 7857 E Neville Ave
- 7854 E Navarro Ave
- 7858 E Navarro Ave
- 7848 E Navarro Ave
- 7854 E Neville Ave
- 7841 E Neville Ave
- 7861 E Neville Ave
- 7848 E Neville Ave
- 7858 E Neville Ave
- 7864 E Navarro Ave
- 7842 E Neville Ave
- 7862 E Neville Ave
- 7835 E Neville Ave
- 7836 E Navarro Ave
- 7855 E Navarro Ave
- 7845 E Natal Ave
- 7849 E Navarro Ave
- 7859 E Navarro Ave
- 7857 E Natal Ave