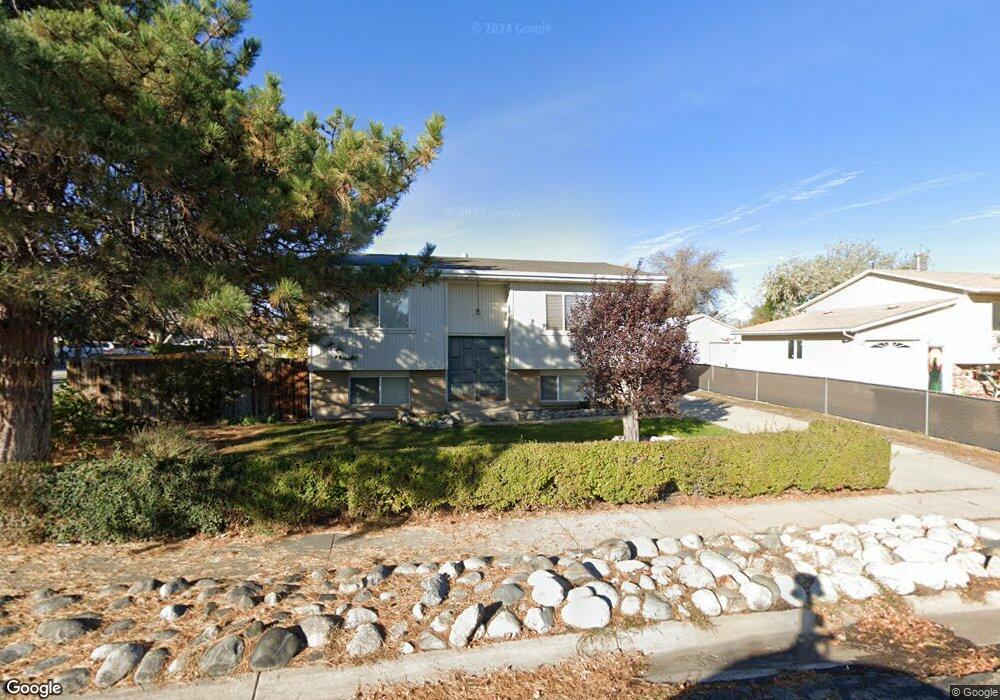
7854 S 3620 W West Jordan, UT 84088
Jordan Oaks NeighborhoodEstimated Value: $439,691 - $472,000
3
Beds
2
Baths
1,030
Sq Ft
$444/Sq Ft
Est. Value
About This Home
This home is located at 7854 S 3620 W, West Jordan, UT 84088 and is currently estimated at $457,673, approximately $444 per square foot. 7854 S 3620 W is a home located in Salt Lake County with nearby schools including Columbia Elementary School, Joel P. Jensen Middle School, and West Jordan High School.
Ownership History
Date
Name
Owned For
Owner Type
Purchase Details
Closed on
Jan 5, 2011
Sold by
Quintana Rey L
Bought by
Quintana Rey L
Current Estimated Value
Home Financials for this Owner
Home Financials are based on the most recent Mortgage that was taken out on this home.
Original Mortgage
$87,000
Interest Rate
3.72%
Mortgage Type
New Conventional
Purchase Details
Closed on
Apr 4, 2003
Sold by
Quintana Coleen K
Bought by
Quintana Rey L
Home Financials for this Owner
Home Financials are based on the most recent Mortgage that was taken out on this home.
Original Mortgage
$84,150
Interest Rate
5.07%
Purchase Details
Closed on
Jun 4, 2001
Sold by
Quintana Coleen K
Bought by
Quintana Rey L
Create a Home Valuation Report for This Property
The Home Valuation Report is an in-depth analysis detailing your home's value as well as a comparison with similar homes in the area
Home Values in the Area
Average Home Value in this Area
Purchase History
| Date | Buyer | Sale Price | Title Company |
|---|---|---|---|
| Quintana Rey L | -- | Backman Title Services | |
| Quintana Rey L | -- | Sutherland Title | |
| Quintana Rey L | -- | -- |
Source: Public Records
Mortgage History
| Date | Status | Borrower | Loan Amount |
|---|---|---|---|
| Closed | Quintana Rey L | $87,000 | |
| Closed | Quintana Rey L | $84,150 |
Source: Public Records
Tax History Compared to Growth
Tax History
| Year | Tax Paid | Tax Assessment Tax Assessment Total Assessment is a certain percentage of the fair market value that is determined by local assessors to be the total taxable value of land and additions on the property. | Land | Improvement |
|---|---|---|---|---|
| 2025 | $2,231 | $434,600 | $99,200 | $335,400 |
| 2024 | $2,231 | $429,300 | $96,300 | $333,000 |
| 2023 | $1,970 | $357,300 | $90,100 | $267,200 |
| 2022 | $2,034 | $362,800 | $88,300 | $274,500 |
| 2021 | $1,704 | $276,700 | $65,300 | $211,400 |
| 2020 | $1,736 | $264,600 | $65,300 | $199,300 |
| 2019 | $1,693 | $253,000 | $65,300 | $187,700 |
| 2018 | $1,337 | $198,200 | $55,500 | $142,700 |
| 2017 | $1,202 | $177,400 | $55,500 | $121,900 |
| 2016 | $1,103 | $152,900 | $55,500 | $97,400 |
| 2015 | $1,037 | $140,200 | $55,000 | $85,200 |
| 2014 | $991 | $131,900 | $52,300 | $79,600 |
Source: Public Records
Map
Nearby Homes
- 3629 W 7825 S
- 3647 W 7865 S
- 3546 W 7980 S
- 3476 W Spaulding Rd
- 7989 S 3725 W
- 7991 S 3725 W
- 3422 Briar Dr
- 3354 W 7800 S
- 8058 S Lismore Ln Unit 304
- 3332 Lower Newark Way
- 7611 S Springbrook Dr
- 8180 S Old Bingham Hwy
- 3977 W Elwood Way
- 3165 W 7720 S
- 3066 W Linton Dr
- 7604 S Autumn Dr
- 8461 S Meadowlark Ln
- 7987 S 2980 W
- 7721 Sunset Cir
- 2886 W 7550 S