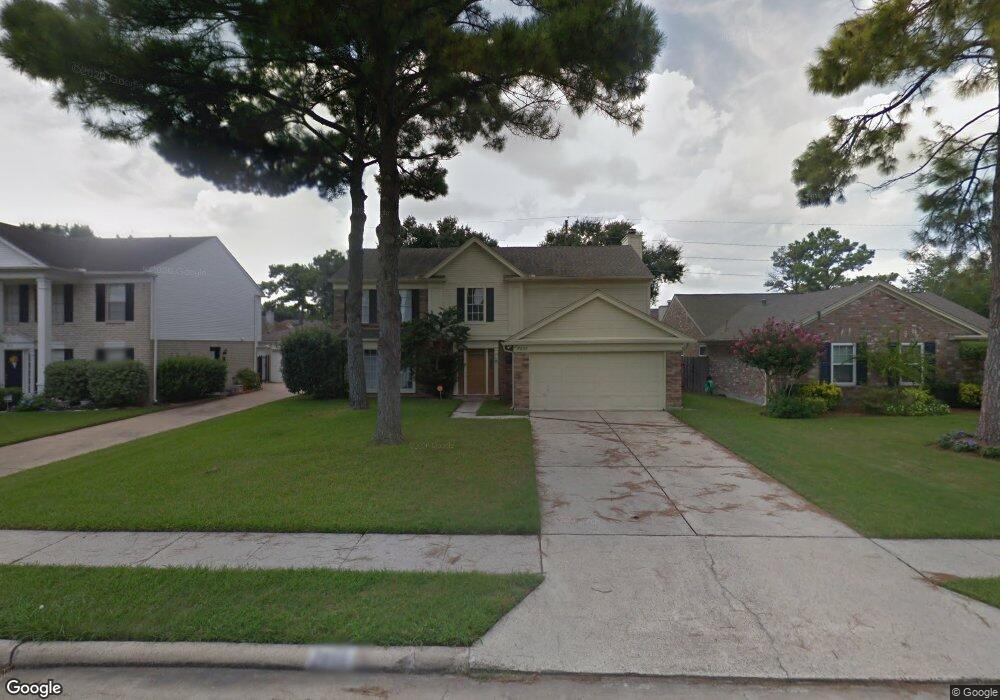
7855 Maple Brook Ln Houston, TX 77095
Copperfield NeighborhoodEstimated Value: $304,754 - $321,000
4
Beds
3
Baths
2,348
Sq Ft
$133/Sq Ft
Est. Value
About This Home
This home is located at 7855 Maple Brook Ln, Houston, TX 77095 and is currently estimated at $312,189, approximately $132 per square foot. 7855 Maple Brook Ln is a home located in Harris County with nearby schools including Lowery Elementary School, Aragon Middle School, and Langham Creek High School.
Ownership History
Date
Name
Owned For
Owner Type
Purchase Details
Closed on
Dec 31, 2012
Sold by
Starco Investments Inc
Bought by
Jones Charles Zachary
Current Estimated Value
Home Financials for this Owner
Home Financials are based on the most recent Mortgage that was taken out on this home.
Original Mortgage
$156,500
Outstanding Balance
$108,662
Interest Rate
3.34%
Mortgage Type
VA
Estimated Equity
$203,527
Purchase Details
Closed on
Aug 9, 2012
Sold by
Fannie Mae
Bought by
Starco Investments Inc
Purchase Details
Closed on
Aug 2, 2011
Sold by
Lyng Cheryl D and Suntrust Mortgage Inc
Bought by
Federal National Mortgage Association and Fannie Mae
Purchase Details
Closed on
Nov 23, 2004
Sold by
Page Dwayne A and Page Debra A
Bought by
Lyng Cheryl D
Home Financials for this Owner
Home Financials are based on the most recent Mortgage that was taken out on this home.
Original Mortgage
$106,000
Interest Rate
5.68%
Mortgage Type
Purchase Money Mortgage
Purchase Details
Closed on
Mar 28, 1994
Sold by
Reilly Michael S and Reilly Karen L
Bought by
Page Dwayne A and Page Debra A
Create a Home Valuation Report for This Property
The Home Valuation Report is an in-depth analysis detailing your home's value as well as a comparison with similar homes in the area
Home Values in the Area
Average Home Value in this Area
Purchase History
| Date | Buyer | Sale Price | Title Company |
|---|---|---|---|
| Jones Charles Zachary | -- | Texas American Title Company | |
| Starco Investments Inc | -- | Texas American Title Co | |
| Federal National Mortgage Association | $102,141 | None Available | |
| Lyng Cheryl D | -- | American Title Co | |
| Page Dwayne A | -- | -- |
Source: Public Records
Mortgage History
| Date | Status | Borrower | Loan Amount |
|---|---|---|---|
| Open | Jones Charles Zachary | $156,500 | |
| Previous Owner | Lyng Cheryl D | $106,000 | |
| Closed | Lyng Cheryl D | $13,250 |
Source: Public Records
Tax History Compared to Growth
Tax History
| Year | Tax Paid | Tax Assessment Tax Assessment Total Assessment is a certain percentage of the fair market value that is determined by local assessors to be the total taxable value of land and additions on the property. | Land | Improvement |
|---|---|---|---|---|
| 2025 | $3,696 | $295,075 | $59,340 | $235,735 |
| 2024 | $3,696 | $297,484 | $59,340 | $238,144 |
| 2023 | $3,696 | $300,379 | $59,340 | $241,039 |
| 2022 | $5,160 | $279,809 | $42,435 | $237,374 |
| 2021 | $4,942 | $212,857 | $42,435 | $170,422 |
| 2020 | $5,112 | $214,361 | $32,775 | $181,586 |
| 2019 | $4,873 | $197,438 | $32,775 | $164,663 |
| 2018 | $1,832 | $190,286 | $32,775 | $157,511 |
| 2017 | $4,184 | $182,402 | $32,775 | $149,627 |
| 2016 | $4,012 | $182,402 | $32,775 | $149,627 |
| 2015 | $2,648 | $182,402 | $32,775 | $149,627 |
| 2014 | $2,648 | $153,944 | $27,255 | $126,689 |
Source: Public Records
Map
Nearby Homes
- 16215 Wemyss Bay Rd
- 16026 Autumn Falls Ln
- 16114 Kintyre Point Rd
- 16215 Cairngorm Ave
- 15918 Pinyon Creek Dr
- 16315 Battlecreek Dr
- 16030 Royal Garden Dr
- 8426 Laurel Trails Dr
- 8526 Hot Springs Dr
- 16319 Chimneystone Dr
- 16335 Drystone Ln
- 8306 Lake Crystal Dr
- 16510 Wellers Way
- 8550 Waiting Spring Ln
- 15854 Knolls Lodge Dr
- 8550 Sparkling Springs Dr
- 15954 Oak Mountain Dr
- 8203 Green Devon Dr
- 16403 Torry View Terrace
- 7622 Mccormick Mill Ct
- 7851 Maple Brook Ln
- 7859 Maple Brook Ln
- 7918 Rothesay Chase Rd
- 7847 Maple Brook Ln
- 7914 Rothesay Chase Rd
- 7922 Rothesay Chase Rd
- 7863 Maple Brook Ln
- 7910 Rothesay Chase Rd
- 16039 Sweetwater Creek Dr
- 7926 Rothesay Chase Rd
- 7843 Maple Brook Ln
- 7906 Rothesay Chase Rd
- 7846 Maple Brook Ln
- 16050 Sweetwater Creek Dr
- 16035 Sweetwater Creek Dr
- 16046 Sweetwater Creek Dr
- 7839 Maple Brook Ln
- 7842 Maple Brook Ln
- 16107 Ronaldsay Mews St
- 16102 Ronaldsay Mews St