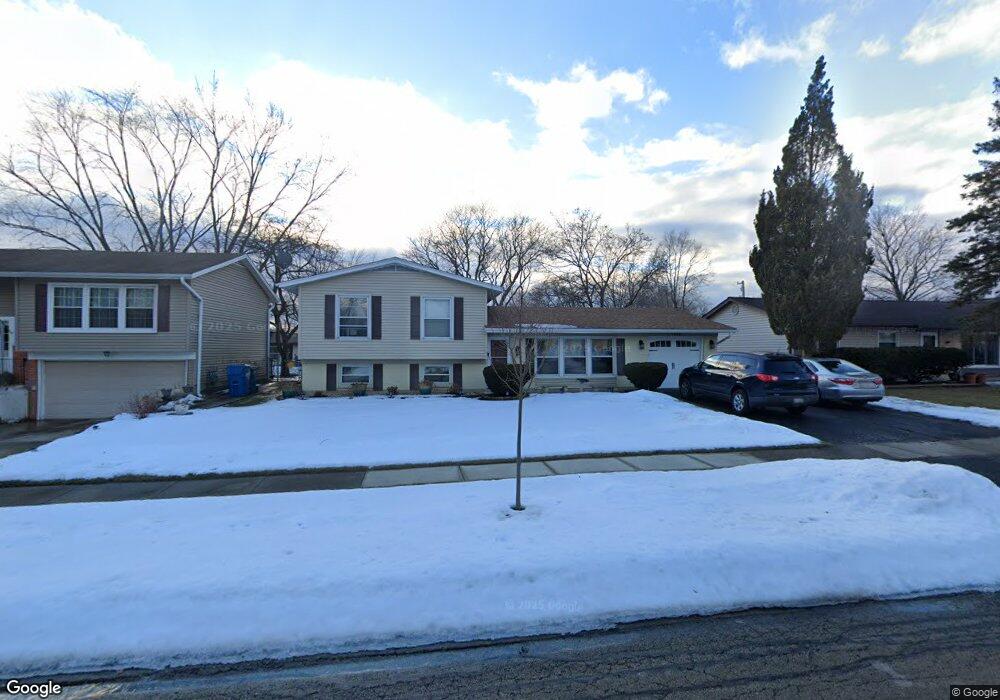
7856 Asbury Cir S Unit 7 Hanover Park, IL 60133
Estimated Value: $350,000 - $383,000
3
Beds
2
Baths
1,600
Sq Ft
$227/Sq Ft
Est. Value
About This Home
This home is located at 7856 Asbury Cir S Unit 7, Hanover Park, IL 60133 and is currently estimated at $363,475, approximately $227 per square foot. 7856 Asbury Cir S Unit 7 is a home located in Cook County with nearby schools including Anne Fox Elementary School, Jane Addams Junior High School, and Hoffman Estates High School.
Ownership History
Date
Name
Owned For
Owner Type
Purchase Details
Closed on
Nov 17, 2011
Sold by
Right Residential Llc
Bought by
Husic Mehmed and Husic Fata
Current Estimated Value
Home Financials for this Owner
Home Financials are based on the most recent Mortgage that was taken out on this home.
Original Mortgage
$161,791
Interest Rate
4.4%
Mortgage Type
FHA
Purchase Details
Closed on
Jul 21, 2011
Sold by
Pineda
Bought by
Right Residential
Purchase Details
Closed on
May 19, 2005
Sold by
Deocampo Jerson and De Ocampo Mildred
Bought by
Pineda Alan and Pineda Belgie
Home Financials for this Owner
Home Financials are based on the most recent Mortgage that was taken out on this home.
Original Mortgage
$172,500
Interest Rate
5.75%
Mortgage Type
Stand Alone First
Purchase Details
Closed on
Jun 28, 1996
Sold by
Kostecki James R and Kostecki Patricia A
Bought by
Deocampo Jersen and Deocampo Mildred
Home Financials for this Owner
Home Financials are based on the most recent Mortgage that was taken out on this home.
Original Mortgage
$114,500
Interest Rate
8.09%
Create a Home Valuation Report for This Property
The Home Valuation Report is an in-depth analysis detailing your home's value as well as a comparison with similar homes in the area
Home Values in the Area
Average Home Value in this Area
Purchase History
| Date | Buyer | Sale Price | Title Company |
|---|---|---|---|
| Husic Mehmed | $166,000 | Cti | |
| Right Residential | $87,000 | None Available | |
| Pineda Alan | $230,000 | Multiple | |
| Deocampo Jersen | $134,500 | -- |
Source: Public Records
Mortgage History
| Date | Status | Borrower | Loan Amount |
|---|---|---|---|
| Previous Owner | Husic Mehmed | $161,791 | |
| Previous Owner | Pineda Alan | $172,500 | |
| Previous Owner | Deocampo Jersen | $114,500 |
Source: Public Records
Tax History Compared to Growth
Tax History
| Year | Tax Paid | Tax Assessment Tax Assessment Total Assessment is a certain percentage of the fair market value that is determined by local assessors to be the total taxable value of land and additions on the property. | Land | Improvement |
|---|---|---|---|---|
| 2024 | $7,160 | $26,000 | $5,118 | $20,882 |
| 2023 | $6,894 | $26,000 | $5,118 | $20,882 |
| 2022 | $6,894 | $26,000 | $5,118 | $20,882 |
| 2021 | $5,524 | $18,954 | $3,346 | $15,608 |
| 2020 | $5,537 | $18,954 | $3,346 | $15,608 |
| 2019 | $5,608 | $21,297 | $3,346 | $17,951 |
| 2018 | $5,470 | $18,865 | $2,952 | $15,913 |
| 2017 | $5,401 | $18,865 | $2,952 | $15,913 |
| 2016 | $5,368 | $18,865 | $2,952 | $15,913 |
| 2015 | $5,163 | $17,171 | $2,559 | $14,612 |
| 2014 | $5,083 | $17,171 | $2,559 | $14,612 |
| 2013 | $6,090 | $18,026 | $2,559 | $15,467 |
Source: Public Records
Map
Nearby Homes
- 7873 Asbury Cir S
- 7843 Kensington Ln
- 7837 Huntington Cir S
- 1307 Kingsbury Dr Unit A
- 1316 Kingsbury Dr Unit 1
- 1323 Kingsbury Dr Unit 2
- 8138 N Carrolton Ct
- 1283 Bristol Ln
- 7526 Bristol Ln Unit 502
- 7523 Bristol Ln Unit A
- 630 S Walnut Ln
- 802 Lexington Cir
- 8181 Northway Dr
- 7418 Nantucket Cove
- 1105 Stratford Ln
- 763 Verandah Dr
- 200 Columbia Ct Unit 5
- 630 Clover Ln
- 136 Caryville Ln
- 7138 Edgebrook Ln
- 7870 Asbury Cir S
- 7844 Asbury Cir S
- 7871 Sherwood Cir S
- 1200 Yorkshire Dr
- 7885 Sherwood Cir S
- 7834 Asbury Cir S
- 7845 Sherwood Cir S
- 1230 Yorkshire Dr
- 7859 Asbury Cir S
- 7847 Asbury Cir S
- 7833 Sherwood Cir S
- 7820 Asbury Cir S
- 7835 Asbury Cir S
- 1180 Yorkshire Dr
- 7801 Sherwood Cir S
- 7823 Asbury Cir S
- 7798 Asbury Cir S
- 1201 Yorkshire Dr
- 1227 Yorkshire Dr
- 7850 Sherwood Cir S