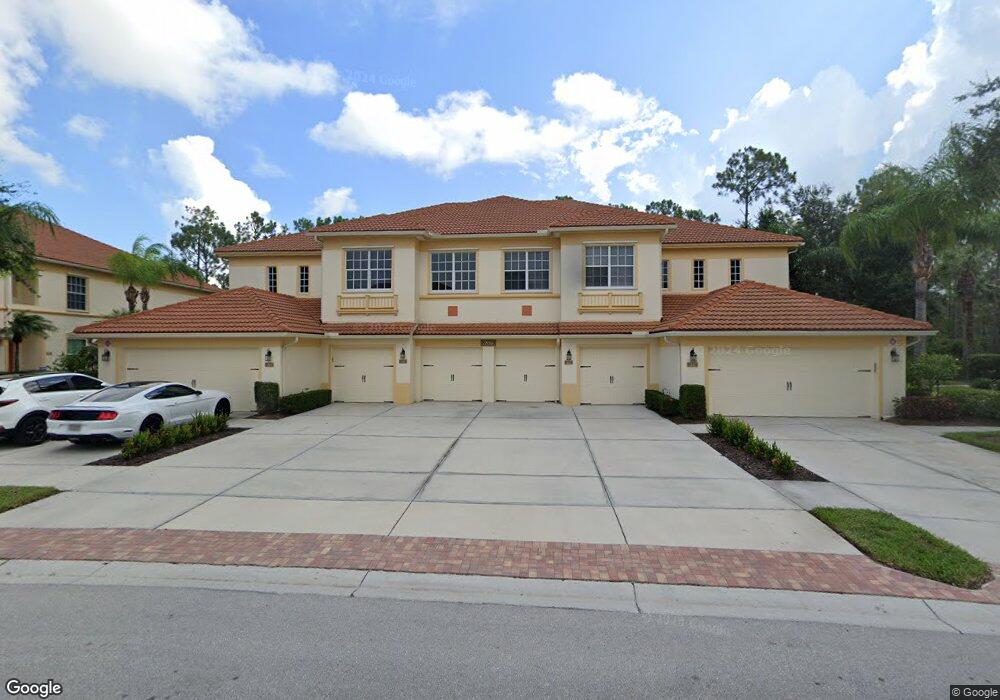
7856 Clemson St Unit 102 Naples, FL 34104
Twelve Lakes NeighborhoodEstimated Value: $423,855 - $428,000
3
Beds
2
Baths
1,748
Sq Ft
$244/Sq Ft
Est. Value
About This Home
This home is located at 7856 Clemson St Unit 102, Naples, FL 34104 and is currently estimated at $425,964, approximately $243 per square foot. 7856 Clemson St Unit 102 is a home located in Collier County with nearby schools including Calusa Park Elementary School, Golden Gate High School, and East Naples Middle School.
Ownership History
Date
Name
Owned For
Owner Type
Purchase Details
Closed on
Jan 27, 2022
Sold by
Baker Barry L and Baker Kimala D
Bought by
Brown Bobby and Brown Jacqueline
Current Estimated Value
Home Financials for this Owner
Home Financials are based on the most recent Mortgage that was taken out on this home.
Original Mortgage
$322,050
Outstanding Balance
$297,831
Interest Rate
3.22%
Mortgage Type
New Conventional
Estimated Equity
$128,133
Purchase Details
Closed on
Oct 28, 2015
Sold by
Baker Bradley Ray
Bought by
Baker Barry L and Baker Kimala D
Home Financials for this Owner
Home Financials are based on the most recent Mortgage that was taken out on this home.
Original Mortgage
$138,000
Interest Rate
3.93%
Mortgage Type
New Conventional
Purchase Details
Closed on
Jul 5, 2011
Sold by
Mieszcak Larry and Losacco Anthony
Bought by
Baker Bradley Ray
Create a Home Valuation Report for This Property
The Home Valuation Report is an in-depth analysis detailing your home's value as well as a comparison with similar homes in the area
Home Values in the Area
Average Home Value in this Area
Purchase History
| Date | Buyer | Sale Price | Title Company |
|---|---|---|---|
| Brown Bobby | $339,000 | New Title Company Name | |
| Baker Barry L | $160,000 | Ross Title & Escrow Inc | |
| Baker Bradley Ray | $179,500 | Attorney |
Source: Public Records
Mortgage History
| Date | Status | Borrower | Loan Amount |
|---|---|---|---|
| Open | Brown Bobby | $322,050 | |
| Previous Owner | Baker Barry L | $138,000 |
Source: Public Records
Tax History Compared to Growth
Tax History
| Year | Tax Paid | Tax Assessment Tax Assessment Total Assessment is a certain percentage of the fair market value that is determined by local assessors to be the total taxable value of land and additions on the property. | Land | Improvement |
|---|---|---|---|---|
| 2025 | $3,723 | $370,860 | -- | $370,860 |
| 2024 | $3,680 | $377,606 | -- | -- |
| 2023 | $3,680 | $366,608 | $0 | $366,608 |
| 2022 | $2,263 | $222,249 | $0 | $0 |
| 2021 | $2,272 | $215,776 | $0 | $215,776 |
| 2020 | $2,248 | $215,374 | $0 | $0 |
| 2019 | $2,203 | $210,532 | $0 | $210,532 |
| 2018 | $2,195 | $210,532 | $0 | $210,532 |
| 2017 | $2,598 | $205,288 | $0 | $205,288 |
| 2016 | $2,377 | $187,036 | $0 | $0 |
| 2015 | $2,209 | $158,631 | $0 | $0 |
| 2014 | $2,023 | $144,210 | $0 | $0 |
Source: Public Records
Map
Nearby Homes
- 7840 Clemson St Unit 201
- 7882 Clemson St Unit 101
- 7903 Founders Cir
- 7914 Founders Cir
- 1280 Wildwood Lakes Blvd Unit 104
- 8610 Cedar Hammock Cir Unit 1245
- 8620 Cedar Hammock Cir Unit 1124
- 1260 Wildwood Lakes Blvd Unit 208
- 1260 Wildwood Lakes Blvd Unit 204
- 1270 Wildwood Lakes Blvd Unit 202
- 8600 Cedar Hammock Cir Unit 1325
- 8600 Cedar Hammock Cir Unit 1313
- 7956 Kilkenny Way Unit G55
- 1265 Wildwood Lakes Blvd Unit 208
- 1265 Wildwood Lakes Blvd Unit 102
- 1250 Wildwood Lakes Blvd Unit 101
- 7870 Clemson St Unit 101
- 7832 Clemson St Unit 101
- 7870 Clemson St Unit 201
- 7874 Clemson St Unit 102
- 7856 Clemson St Unit 202
- 7856 Clemson St Unit 8-102
- 7870 Clemson St Unit 202
- 7874 Clemson St Unit 101
- 7870 Clemson St Unit 10202
- 7870 Clemson St
- 7870 Clemson St
- 7856 Clemson St
- 7856 Clemson St
- 7856 Clemson St
- 7832 Clemson St
- 7832 Clemson St
- 7832 Clemson St Unit 2101
- 7832 Clemson St Unit 2201
- 7874 Clemson St Unit 11102
- 7870 Clemson St Unit 10102