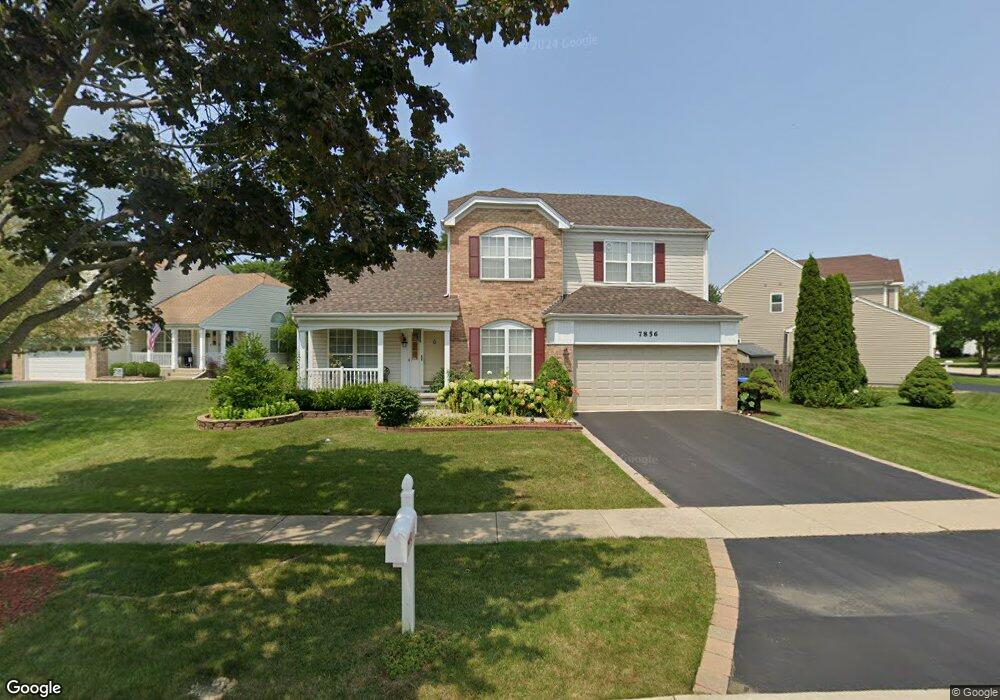
7856 Geneva Dr Gurnee, IL 60031
Estimated Value: $369,537 - $392,000
3
Beds
3
Baths
1,712
Sq Ft
$224/Sq Ft
Est. Value
About This Home
This home is located at 7856 Geneva Dr, Gurnee, IL 60031 and is currently estimated at $383,134, approximately $223 per square foot. 7856 Geneva Dr is a home located in Lake County with nearby schools including Woodland Primary School, Woodland Elementary School, and Woodland Intermediate School.
Ownership History
Date
Name
Owned For
Owner Type
Purchase Details
Closed on
Dec 9, 1999
Sold by
Machalski
Bought by
Federal National Mortgage Association
Current Estimated Value
Home Financials for this Owner
Home Financials are based on the most recent Mortgage that was taken out on this home.
Original Mortgage
$162,000
Outstanding Balance
$50,752
Interest Rate
7.87%
Estimated Equity
$332,382
Purchase Details
Closed on
Dec 7, 1999
Sold by
Federal National Mortgage Association
Bought by
Gomez Gabriel M and Gomez Nemesia A
Home Financials for this Owner
Home Financials are based on the most recent Mortgage that was taken out on this home.
Original Mortgage
$162,000
Outstanding Balance
$50,752
Interest Rate
7.87%
Estimated Equity
$332,382
Purchase Details
Closed on
Apr 3, 1995
Sold by
Sundance Holdings Inc
Bought by
Machalski Lawrence A
Home Financials for this Owner
Home Financials are based on the most recent Mortgage that was taken out on this home.
Original Mortgage
$163,400
Interest Rate
8.79%
Create a Home Valuation Report for This Property
The Home Valuation Report is an in-depth analysis detailing your home's value as well as a comparison with similar homes in the area
Home Values in the Area
Average Home Value in this Area
Purchase History
| Date | Buyer | Sale Price | Title Company |
|---|---|---|---|
| Federal National Mortgage Association | -- | Greater Illinois Title Compa | |
| Gomez Gabriel M | -- | Greater Illinois Title Compa | |
| Machalski Lawrence A | $182,000 | Ticor Title Insurance Compan |
Source: Public Records
Mortgage History
| Date | Status | Borrower | Loan Amount |
|---|---|---|---|
| Open | Gomez Gabriel M | $162,000 | |
| Previous Owner | Machalski Lawrence A | $163,400 |
Source: Public Records
Tax History
| Year | Tax Paid | Tax Assessment Tax Assessment Total Assessment is a certain percentage of the fair market value that is determined by local assessors to be the total taxable value of land and additions on the property. | Land | Improvement |
|---|---|---|---|---|
| 2024 | $4,864 | $104,997 | $21,117 | $83,880 |
| 2023 | $4,864 | $97,481 | $19,605 | $77,876 |
| 2022 | $5,311 | $93,356 | $19,611 | $73,745 |
| 2021 | $5,013 | $89,610 | $18,824 | $70,786 |
| 2020 | $4,981 | $87,407 | $18,361 | $69,046 |
| 2019 | $4,922 | $84,869 | $17,828 | $67,041 |
| 2018 | $5,006 | $77,552 | $18,748 | $58,804 |
| 2017 | $5,030 | $75,330 | $18,211 | $57,119 |
| 2016 | $5,238 | $71,976 | $17,400 | $54,576 |
| 2015 | $5,398 | $68,262 | $16,502 | $51,760 |
| 2014 | $5,365 | $65,491 | $16,267 | $49,224 |
| 2012 | $5,553 | $65,993 | $16,392 | $49,601 |
Source: Public Records
Map
Nearby Homes
- 18500 W Aspen Ct
- 528 Cliffwood Ln
- 415 Kingsport Dr
- 7817 Cascade Way
- 34271 N Tangueray Dr
- 18224 W Old Pine Ct
- 18184 W Old Pine Ct
- 7449 Brentwood Ln
- 7421 Prescott Ln
- 11 Spinnaker Ct
- 701 Caitlin Ct
- 968 Knowles Rd
- 34115 N Wooded Glen Dr
- 767 Aster Dr
- 33771 N 2nd St
- 33762 N Oak St
- 18238 W Gages Lake Rd
- 18631 W Main St
- 1094 Vista Dr
- 1107 Vineyard Dr
- 7850 Geneva Dr
- 7862 Geneva Dr
- 7844 Geneva Dr
- 7868 Geneva Dr
- 7838 Geneva Dr
- 7855 Geneva Dr
- 7849 Geneva Dr
- 7861 Geneva Dr
- 388 Sierra Place
- 7874 Geneva Dr
- 385 Sierra Place Unit 2
- 7832 Geneva Dr
- 7867 Geneva Dr
- 7880 Geneva Dr
- 7873 Geneva Dr
- 7885 Geneva Dr
- 391 Sierra Place
- 7791 Milan Way
- 394 Sierra Place
- 7826 Geneva Dr
Your Personal Tour Guide
Ask me questions while you tour the home.