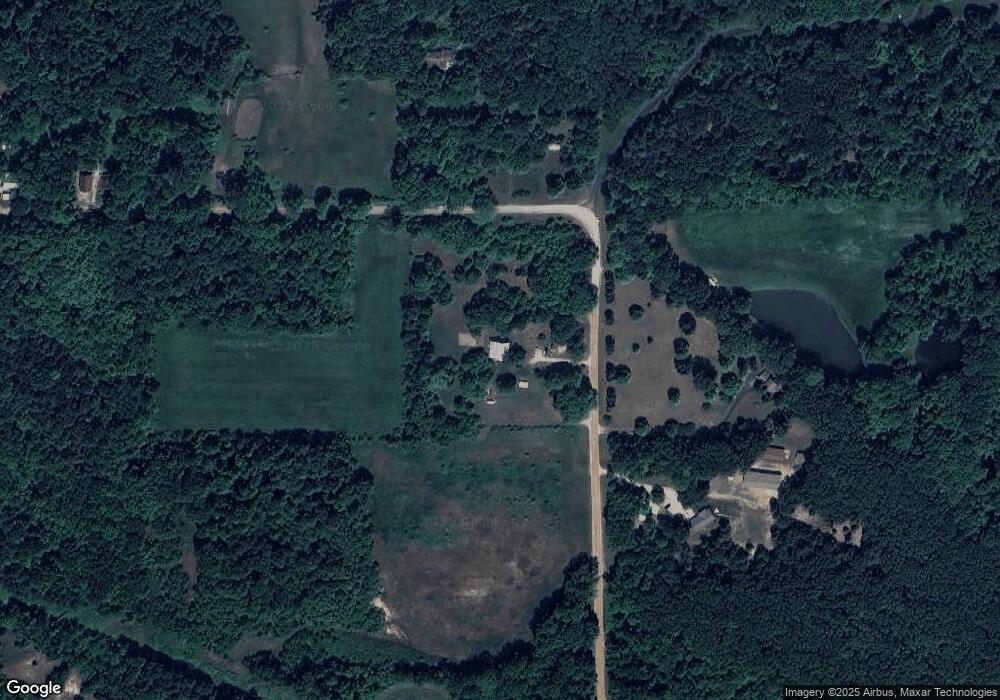
786 24th St Otsego, MI 49078
Estimated Value: $207,755 - $293,000
3
Beds
1
Bath
1,260
Sq Ft
$201/Sq Ft
Est. Value
About This Home
This home is located at 786 24th St, Otsego, MI 49078 and is currently estimated at $253,189, approximately $200 per square foot. 786 24th St is a home located in Allegan County with nearby schools including Pine Trails Elementary School, L.E. White Middle School, and Allegan High School.
Ownership History
Date
Name
Owned For
Owner Type
Purchase Details
Closed on
Jun 6, 2016
Sold by
Jones Rick James and Jones Lorrie Lynn
Bought by
Jones Rick James and Jones Lorrie Lynn
Current Estimated Value
Home Financials for this Owner
Home Financials are based on the most recent Mortgage that was taken out on this home.
Original Mortgage
$112,585
Interest Rate
3.25%
Mortgage Type
FHA
Purchase Details
Closed on
Apr 9, 2013
Sold by
Jones Rick James
Bought by
Jones Rick James and Lenard Lorrie Lynn
Purchase Details
Closed on
Mar 3, 2011
Sold by
Jones Rick James and Jones Diane Dana
Bought by
Jones Rick James
Purchase Details
Closed on
Sep 11, 2007
Sold by
Jones Rick J and Jones Diane D
Bought by
Jones Rick J
Home Financials for this Owner
Home Financials are based on the most recent Mortgage that was taken out on this home.
Original Mortgage
$134,995
Interest Rate
6.55%
Mortgage Type
New Conventional
Create a Home Valuation Report for This Property
The Home Valuation Report is an in-depth analysis detailing your home's value as well as a comparison with similar homes in the area
Home Values in the Area
Average Home Value in this Area
Purchase History
| Date | Buyer | Sale Price | Title Company |
|---|---|---|---|
| Jones Rick James | $500 | American Guaranty Title Insu | |
| Jones Rick James | -- | None Available | |
| Jones Rick James | -- | None Available | |
| Jones Rick J | -- | Title Source Inc |
Source: Public Records
Mortgage History
| Date | Status | Borrower | Loan Amount |
|---|---|---|---|
| Closed | Jones Rick James | $112,585 | |
| Closed | Jones Rick J | $134,995 |
Source: Public Records
Tax History Compared to Growth
Tax History
| Year | Tax Paid | Tax Assessment Tax Assessment Total Assessment is a certain percentage of the fair market value that is determined by local assessors to be the total taxable value of land and additions on the property. | Land | Improvement |
|---|---|---|---|---|
| 2025 | $1,474 | $94,400 | $41,700 | $52,700 |
| 2024 | $1,356 | $78,300 | $31,700 | $46,600 |
| 2023 | $1,356 | $68,200 | $27,300 | $40,900 |
| 2022 | $1,356 | $64,500 | $25,700 | $38,800 |
| 2021 | $1,287 | $58,700 | $23,300 | $35,400 |
| 2020 | $1,287 | $56,600 | $22,300 | $34,300 |
| 2019 | $0 | $52,800 | $21,800 | $31,000 |
| 2018 | $0 | $50,200 | $22,100 | $28,100 |
| 2017 | $0 | $46,700 | $19,300 | $27,400 |
| 2016 | $0 | $44,900 | $19,400 | $25,500 |
| 2015 | -- | $44,900 | $19,400 | $25,500 |
| 2014 | -- | $41,900 | $19,200 | $22,700 |
| 2013 | -- | $37,600 | $15,800 | $21,800 |
Source: Public Records
Map
Nearby Homes