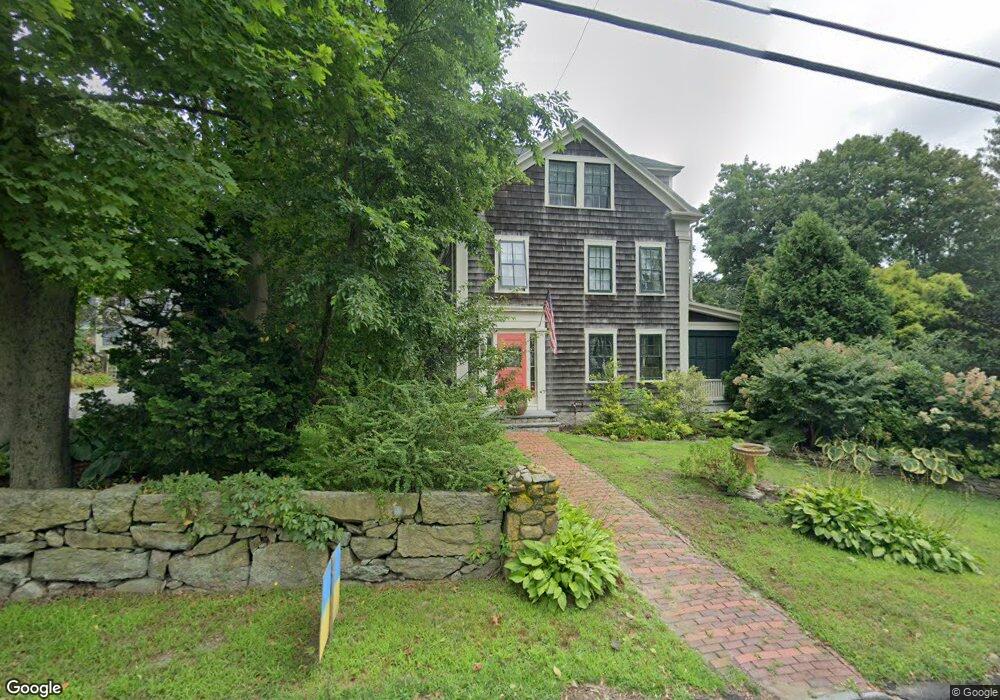
786 Dartmouth St Unit 786 South Dartmouth, MA 02748
Dartmouth Community Park NeighborhoodEstimated Value: $931,000 - $1,310,000
4
Beds
3
Baths
3,481
Sq Ft
$302/Sq Ft
Est. Value
About This Home
This home is located at 786 Dartmouth St Unit 786, South Dartmouth, MA 02748 and is currently estimated at $1,051,325, approximately $302 per square foot. 786 Dartmouth St Unit 786 is a home located in Bristol County with nearby schools including Dartmouth High School and St. Teresa of Calcutta School.
Ownership History
Date
Name
Owned For
Owner Type
Purchase Details
Closed on
Aug 31, 2017
Sold by
Ronald T & D L Shafer Re
Bought by
Brown Stuart T and Brown Barbara P
Current Estimated Value
Home Financials for this Owner
Home Financials are based on the most recent Mortgage that was taken out on this home.
Original Mortgage
$456,000
Outstanding Balance
$376,627
Interest Rate
3.5%
Mortgage Type
New Conventional
Estimated Equity
$674,698
Purchase Details
Closed on
Aug 2, 2010
Sold by
Cochran Barbara T
Bought by
T Ronald
Home Financials for this Owner
Home Financials are based on the most recent Mortgage that was taken out on this home.
Original Mortgage
$93,000
Interest Rate
4.78%
Mortgage Type
Purchase Money Mortgage
Purchase Details
Closed on
Aug 5, 2008
Sold by
Novick Andrew C
Bought by
Cochran Barbara
Purchase Details
Closed on
Aug 20, 1992
Sold by
Parker Henry S and Parker Susan B
Bought by
Munro Martha
Home Financials for this Owner
Home Financials are based on the most recent Mortgage that was taken out on this home.
Original Mortgage
$148,000
Interest Rate
8.12%
Mortgage Type
Purchase Money Mortgage
Create a Home Valuation Report for This Property
The Home Valuation Report is an in-depth analysis detailing your home's value as well as a comparison with similar homes in the area
Home Values in the Area
Average Home Value in this Area
Purchase History
| Date | Buyer | Sale Price | Title Company |
|---|---|---|---|
| Brown Stuart T | $570,000 | -- | |
| T Ronald | $500,000 | -- | |
| Cochran Barbara | $510,000 | -- | |
| Munro Martha | $190,000 | -- |
Source: Public Records
Mortgage History
| Date | Status | Borrower | Loan Amount |
|---|---|---|---|
| Open | Brown Stuart T | $456,000 | |
| Previous Owner | Munro Martha | $93,000 | |
| Previous Owner | Munro Martha | $336,000 | |
| Previous Owner | Munro Martha | $148,000 | |
| Previous Owner | Munro Martha | $68,500 |
Source: Public Records
Tax History Compared to Growth
Tax History
| Year | Tax Paid | Tax Assessment Tax Assessment Total Assessment is a certain percentage of the fair market value that is determined by local assessors to be the total taxable value of land and additions on the property. | Land | Improvement |
|---|---|---|---|---|
| 2025 | $6,136 | $712,700 | $251,400 | $461,300 |
| 2024 | $6,184 | $711,600 | $251,400 | $460,200 |
| 2023 | $6,249 | $681,500 | $251,400 | $430,100 |
| 2022 | $5,942 | $600,200 | $251,400 | $348,800 |
| 2021 | $5,802 | $560,000 | $221,900 | $338,100 |
| 2020 | $5,702 | $549,300 | $213,000 | $336,300 |
| 2019 | $5,640 | $542,300 | $217,500 | $324,800 |
| 2018 | $5,022 | $489,100 | $207,100 | $282,000 |
| 2017 | $4,618 | $460,900 | $184,300 | $276,600 |
| 2016 | $4,699 | $462,500 | $188,500 | $274,000 |
| 2015 | $4,575 | $451,200 | $173,600 | $277,600 |
| 2014 | $4,525 | $443,200 | $171,600 | $271,600 |
Source: Public Records
Map
Nearby Homes
- 786 Dartmouth St
- 784 Dartmouth St
- 780 Dartmouth St
- 64 Prospect St
- 60 Prospect St
- 60 Prospect St Unit 1
- 68 Prospect St
- 58 Prospect St
- 76 Prospect St
- 788 Dartmouth St
- 778 Dartmouth St
- 779 Dartmouth St
- 776 Dartmouth St
- 56 Prospect St
- 80 Prospect St
- 5495 Dartmouth St
- 9999 Dartmouth St
- 53 Prospect St
- 61 Prospect St
- 792 Dartmouth St