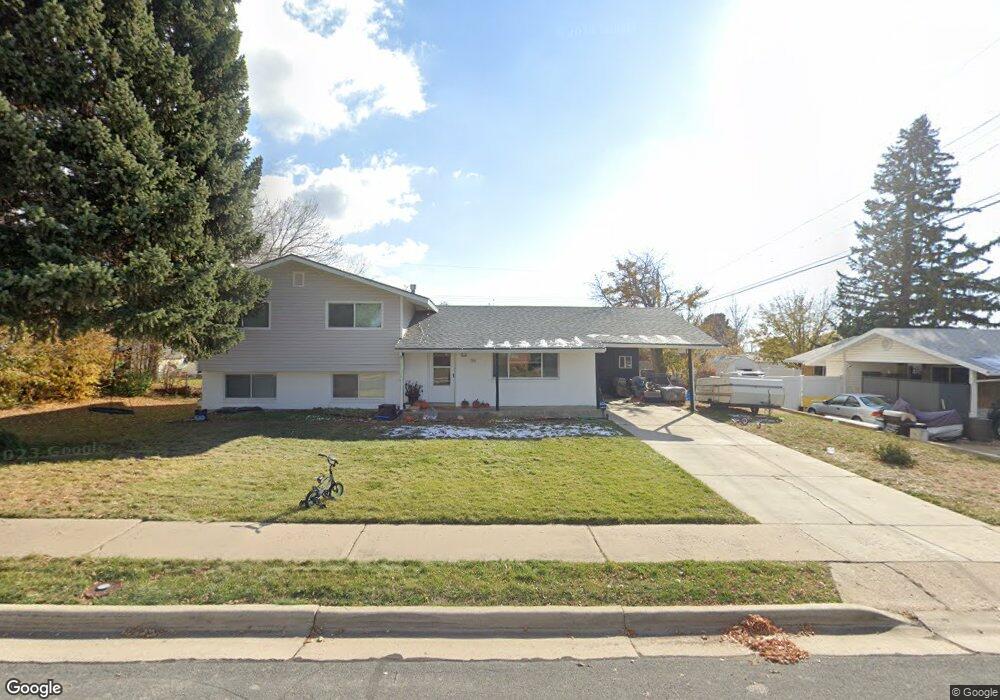
786 E 350 N Kaysville, UT 84037
Estimated Value: $467,000 - $519,000
3
Beds
2
Baths
2,491
Sq Ft
$197/Sq Ft
Est. Value
About This Home
This home is located at 786 E 350 N, Kaysville, UT 84037 and is currently estimated at $491,530, approximately $197 per square foot. 786 E 350 N is a home located in Davis County with nearby schools including H.C. Burton Elementary School, Kaysville Junior High School, and Davis High School.
Ownership History
Date
Name
Owned For
Owner Type
Purchase Details
Closed on
Jul 23, 2020
Sold by
Tingey Kirk T and Tingey Janelee K
Bought by
Potter Rossiter Skoy and Potter Maciah Marie
Current Estimated Value
Home Financials for this Owner
Home Financials are based on the most recent Mortgage that was taken out on this home.
Original Mortgage
$307,749
Outstanding Balance
$273,398
Interest Rate
3.2%
Mortgage Type
New Conventional
Estimated Equity
$218,132
Purchase Details
Closed on
Apr 27, 2018
Sold by
Bingham Gary R and Bingham Ann D
Bought by
Tingey Kirk T and Tingey Janelle K
Home Financials for this Owner
Home Financials are based on the most recent Mortgage that was taken out on this home.
Original Mortgage
$270,019
Interest Rate
4.4%
Mortgage Type
FHA
Purchase Details
Closed on
Apr 24, 2017
Sold by
Newton Steven and Newton Sally A
Bought by
Newton Steven Lamar and Newton Sally Ann
Create a Home Valuation Report for This Property
The Home Valuation Report is an in-depth analysis detailing your home's value as well as a comparison with similar homes in the area
Home Values in the Area
Average Home Value in this Area
Purchase History
| Date | Buyer | Sale Price | Title Company |
|---|---|---|---|
| Potter Rossiter Skoy | -- | Cottonwood Title In | |
| Tingey Kirk T | -- | North Americian Title | |
| Newton Steven Lamar | -- | Us Title |
Source: Public Records
Mortgage History
| Date | Status | Borrower | Loan Amount |
|---|---|---|---|
| Open | Potter Rossiter Skoy | $307,749 | |
| Previous Owner | Tingey Kirk T | $270,019 |
Source: Public Records
Tax History Compared to Growth
Tax History
| Year | Tax Paid | Tax Assessment Tax Assessment Total Assessment is a certain percentage of the fair market value that is determined by local assessors to be the total taxable value of land and additions on the property. | Land | Improvement |
|---|---|---|---|---|
| 2024 | $2,331 | $245,850 | $130,557 | $115,293 |
| 2023 | $2,308 | $431,000 | $225,502 | $205,498 |
| 2022 | $2,341 | $245,300 | $121,425 | $123,875 |
| 2021 | $2,153 | $338,000 | $166,081 | $171,919 |
| 2020 | $1,746 | $267,000 | $137,974 | $129,026 |
| 2019 | $1,725 | $259,000 | $163,617 | $95,383 |
| 2018 | $1,583 | $237,000 | $143,188 | $93,812 |
| 2016 | $170 | $108,240 | $34,772 | $73,468 |
| 2015 | $1,338 | $99,935 | $34,772 | $65,163 |
| 2014 | $290 | $98,725 | $34,772 | $63,953 |
| 2013 | -- | $86,107 | $38,948 | $47,159 |
Source: Public Records
Map
Nearby Homes
- 289 N 700 E
- 380 N 1000 E
- 636 E 100 N
- 272 Pin Oak Ln
- 425 E 500 N
- 1306 N Thornfield Rd
- 947 E Green Rd
- 285 E 500 N
- 1236 E 100 S
- 331 E 100 S
- 890 E Brookshire Dr
- 309 E 100 S
- 952 N Kingswood Rd
- 457 N 150 E
- 400 N 100 E
- 862 N Ellison Rd Unit 20
- 1779 250 N Unit 29-R
- 1730 250 N Unit 23-R
- 1616 250 N Unit 26-R
- 1365 E Oakmont Ln