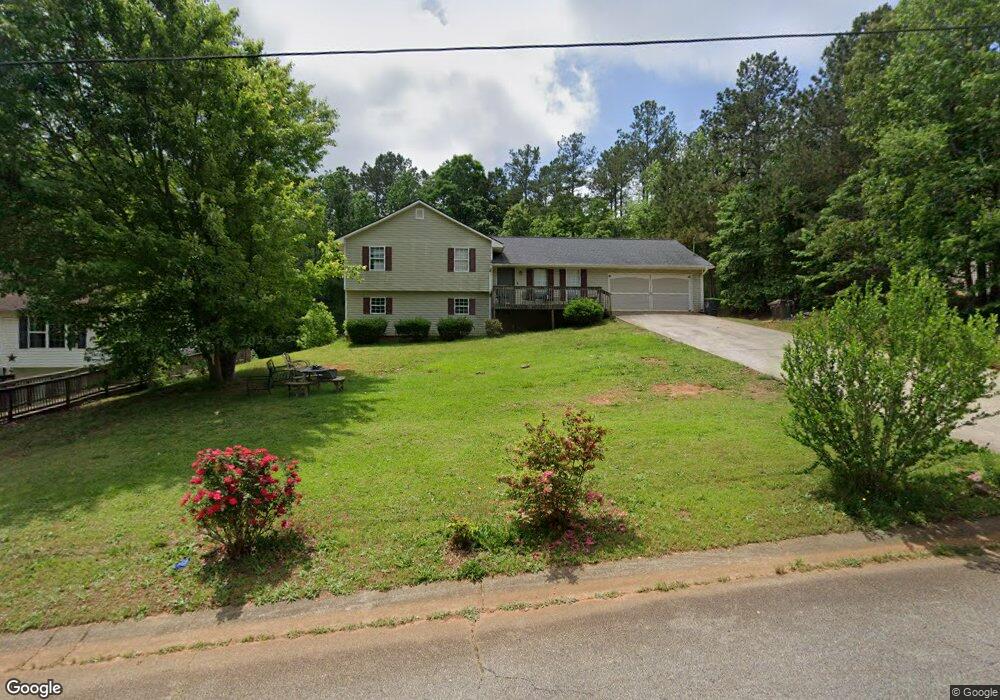
786 Eagles Nest Cir Carrollton, GA 30116
Estimated Value: $263,000 - $294,000
3
Beds
2
Baths
1,578
Sq Ft
$176/Sq Ft
Est. Value
About This Home
This home is located at 786 Eagles Nest Cir, Carrollton, GA 30116 and is currently estimated at $278,261, approximately $176 per square foot. 786 Eagles Nest Cir is a home located in Carroll County with nearby schools including Central Elementary School, Central Middle School, and Central High School.
Ownership History
Date
Name
Owned For
Owner Type
Purchase Details
Closed on
Apr 6, 2022
Sold by
Mason Geraldine
Bought by
Mason Geraldine and Mason Christina
Current Estimated Value
Home Financials for this Owner
Home Financials are based on the most recent Mortgage that was taken out on this home.
Original Mortgage
$89,438
Outstanding Balance
$83,649
Interest Rate
3.85%
Mortgage Type
FHA
Estimated Equity
$194,612
Purchase Details
Closed on
Dec 28, 2015
Sold by
Childers Jeffrey Scott
Bought by
Mason Geraldine
Home Financials for this Owner
Home Financials are based on the most recent Mortgage that was taken out on this home.
Original Mortgage
$98,000
Interest Rate
3.97%
Mortgage Type
New Conventional
Purchase Details
Closed on
Nov 8, 2002
Sold by
Mcdowell Jimmy G
Bought by
Childers Jeffrey S and Childers Pamela L
Purchase Details
Closed on
Jun 12, 2001
Sold by
Mcdowell Dennis H
Bought by
Mcdowell Jimmy G
Purchase Details
Closed on
Apr 28, 1999
Bought by
Mcdowell Dennis H
Create a Home Valuation Report for This Property
The Home Valuation Report is an in-depth analysis detailing your home's value as well as a comparison with similar homes in the area
Home Values in the Area
Average Home Value in this Area
Purchase History
| Date | Buyer | Sale Price | Title Company |
|---|---|---|---|
| Mason Geraldine | -- | -- | |
| Mason Geraldine | $105,000 | -- | |
| Childers Jeffrey S | $115,000 | -- | |
| Mcdowell Jimmy G | $28,000 | -- | |
| Mcdowell Dennis H | -- | -- |
Source: Public Records
Mortgage History
| Date | Status | Borrower | Loan Amount |
|---|---|---|---|
| Open | Mason Geraldine | $89,438 | |
| Previous Owner | Mason Geraldine | $98,000 |
Source: Public Records
Tax History Compared to Growth
Tax History
| Year | Tax Paid | Tax Assessment Tax Assessment Total Assessment is a certain percentage of the fair market value that is determined by local assessors to be the total taxable value of land and additions on the property. | Land | Improvement |
|---|---|---|---|---|
| 2024 | $2,670 | $118,031 | $7,400 | $110,631 |
| 2023 | $2,670 | $108,053 | $7,400 | $100,653 |
| 2022 | $2,177 | $86,818 | $6,000 | $80,818 |
| 2021 | $1,927 | $75,183 | $6,000 | $69,183 |
| 2020 | $1,532 | $59,688 | $6,000 | $53,688 |
| 2019 | $1,434 | $55,417 | $6,000 | $49,417 |
| 2018 | $1,309 | $49,846 | $4,000 | $45,846 |
| 2017 | $1,106 | $49,846 | $4,000 | $45,846 |
| 2016 | $1,144 | $49,846 | $4,000 | $45,846 |
| 2015 | $1,068 | $42,198 | $4,000 | $38,198 |
| 2014 | $912 | $36,469 | $4,000 | $32,469 |
Source: Public Records
Map
Nearby Homes
- 770 Eagles Nest Cir
- 812 Eagles Nest Cir
- 1228 Eagles Nest Cir
- 746 Eagles Nest Cir
- 1218 Eagles Nest Cir
- 787 Eagles Nest Cir
- 832 Eagles Nest Cir
- 1234 Eagles Nest Cir
- 813 Eagles Nest Cir
- 1204 Eagles Nest Cir
- 1250 Eagles Nest Cir
- 101 Rulon Ct
- 836 Eagles Nest Cir
- 722 Eagles Nest Cir
- 1184 Eagles Nest Cir
- 1266 Eagles Nest Cir
- 1266 Eagles Nest Cir
- 0 Rulon Ct Unit 7501920
- 0 Rulon Ct Unit 8131781
- 0 Rulon Ct Unit 7397215