7861 S Kalispell Cir Englewood, CO 80112
Estimated Value: $403,000 - $432,000
3
Beds
3
Baths
1,400
Sq Ft
$295/Sq Ft
Est. Value
About This Home
This home is located at 7861 S Kalispell Cir, Englewood, CO 80112 and is currently estimated at $413,438, approximately $295 per square foot. 7861 S Kalispell Cir is a home located in Arapahoe County with nearby schools including Red Hawk Ridge Elementary School, Liberty Middle School, and Grandview High School.
Ownership History
Date
Name
Owned For
Owner Type
Purchase Details
Closed on
Sep 2, 2011
Sold by
Secretary Of Housing & Urban Development
Bought by
Heckaman Rebecca J and Heckaman Aaron D
Current Estimated Value
Home Financials for this Owner
Home Financials are based on the most recent Mortgage that was taken out on this home.
Original Mortgage
$89,600
Outstanding Balance
$8,043
Interest Rate
4.53%
Mortgage Type
New Conventional
Estimated Equity
$405,395
Purchase Details
Closed on
May 18, 2011
Sold by
Robertson Smith Sherry and Midfirst Bank
Bought by
The Secretary Of Housing & Urban Develop
Purchase Details
Closed on
Nov 23, 2001
Sold by
Kb Home Colorado Inc
Bought by
Smith Sherry Robertson
Home Financials for this Owner
Home Financials are based on the most recent Mortgage that was taken out on this home.
Original Mortgage
$171,086
Interest Rate
6.57%
Mortgage Type
FHA
Create a Home Valuation Report for This Property
The Home Valuation Report is an in-depth analysis detailing your home's value as well as a comparison with similar homes in the area
Home Values in the Area
Average Home Value in this Area
Purchase History
| Date | Buyer | Sale Price | Title Company |
|---|---|---|---|
| Heckaman Rebecca J | $112,000 | Ats | |
| The Secretary Of Housing & Urban Develop | $173,946 | None Available | |
| Smith Sherry Robertson | $173,772 | -- |
Source: Public Records
Mortgage History
| Date | Status | Borrower | Loan Amount |
|---|---|---|---|
| Open | Heckaman Rebecca J | $89,600 | |
| Previous Owner | Smith Sherry Robertson | $171,086 |
Source: Public Records
Tax History Compared to Growth
Tax History
| Year | Tax Paid | Tax Assessment Tax Assessment Total Assessment is a certain percentage of the fair market value that is determined by local assessors to be the total taxable value of land and additions on the property. | Land | Improvement |
|---|---|---|---|---|
| 2024 | $2,483 | $25,587 | -- | -- |
| 2023 | $2,483 | $25,587 | $0 | $0 |
| 2022 | $2,255 | $21,830 | $0 | $0 |
| 2021 | $2,538 | $21,830 | $0 | $0 |
| 2020 | $2,475 | $20,935 | $0 | $0 |
| 2019 | $2,421 | $20,935 | $0 | $0 |
| 2018 | $2,155 | $17,618 | $0 | $0 |
| 2017 | $2,144 | $17,618 | $0 | $0 |
| 2016 | $1,943 | $14,814 | $0 | $0 |
| 2015 | $1,905 | $14,814 | $0 | $0 |
| 2014 | $1,389 | $9,799 | $0 | $0 |
| 2013 | -- | $10,890 | $0 | $0 |
Source: Public Records
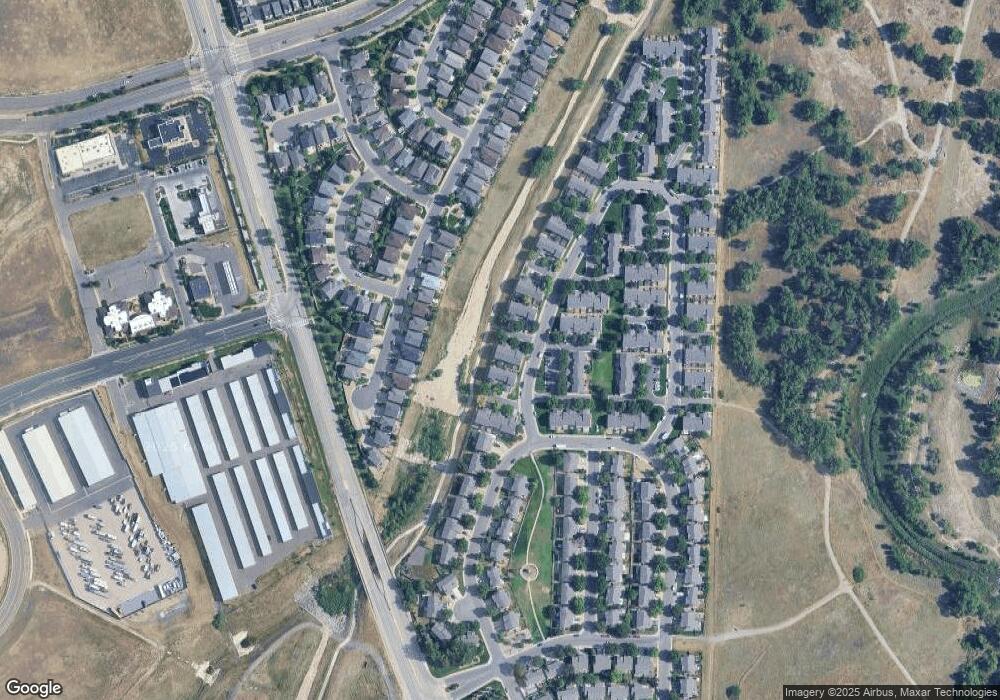
Map
Nearby Homes
- 7898 S Joplin Ct
- 7889 S Kittredge Cir
- 7945 S Kittredge St
- 7751 S Kittredge Ct
- 7951 S Kittredge Way
- 7959 S Kittredge Way
- 7979 S Kittredge Way
- 7644 S Joplin Ct
- 15763 E Broncos Place
- 8032 S Kalispell Way
- 15882 E Broncos Place
- 15700 E Jamison Dr Unit 7-305
- 15700 E Jamison Dr Unit 105
- 15700 E Jamison Dr Unit 8-305
- 15700 E Jamison Dr Unit 7-101
- 15700 E Jamison Dr Unit 5-107
- 15700 E Jamison Dr Unit 8-102
- 15700 E Jamison Dr Unit 1307
- 16020 E Otero Place
- 16276 E Otero Place
- 7863 S Kalispell Cir
- 7865 S Kalispell Cir
- 7867 S Kalispell Cir
- 7877 S Kalispell Cir
- 7875 S Kalispell Cir
- 7873 S Kalispell Cir
- 7857 S Kalispell Cir
- 7855 S Kalispell Cir
- 7871 S Kalispell Cir
- 7853 S Kalispell Cir
- 7851 S Kalispell Cir
- 7856 S Kalispell Cir
- 7881 S Kalispell Cir
- 7885 S Kalispell Cir
- 7843 S Kalispell Cir
- 7845 S Kalispell Cir
- 7887 S Kalispell Cir
- 7847 S Kalispell Cir
- 7889 S Kalispell Cir
- 7858 S Kalispell Cir