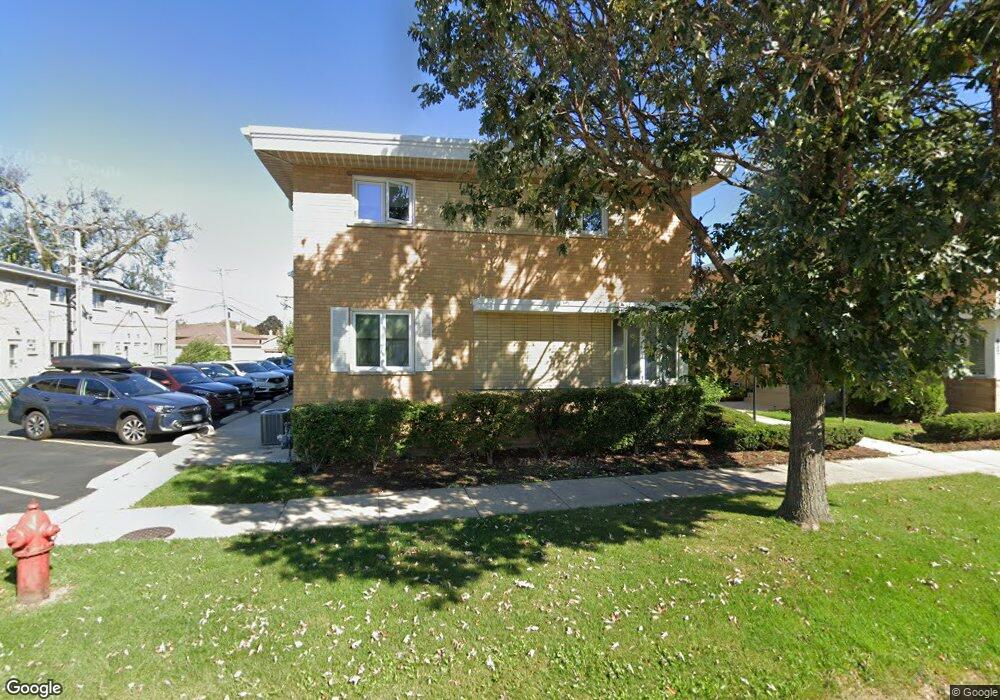
7862 W Lawrence Ave Norridge, IL 60706
Estimated Value: $290,091 - $392,000
3
Beds
2
Baths
1,112
Sq Ft
$288/Sq Ft
Est. Value
About This Home
This home is located at 7862 W Lawrence Ave, Norridge, IL 60706 and is currently estimated at $320,273, approximately $288 per square foot. 7862 W Lawrence Ave is a home located in Cook County with nearby schools including J Leigh Elementary School, Ridgewood Community High School, and St Eugene School.
Ownership History
Date
Name
Owned For
Owner Type
Purchase Details
Closed on
Nov 17, 2006
Sold by
Marcinkowska Ewa Mori
Bought by
Marcinkowska Ewa Mori and Ewa Mori Marcinkowska Living Trust
Current Estimated Value
Purchase Details
Closed on
Nov 13, 1995
Sold by
Community Svgs Bank
Bought by
Mori Marcinkowski Ewa and Marcikowski Peter A
Home Financials for this Owner
Home Financials are based on the most recent Mortgage that was taken out on this home.
Original Mortgage
$64,000
Outstanding Balance
$892
Interest Rate
7.56%
Estimated Equity
$319,381
Purchase Details
Closed on
Jul 12, 1994
Sold by
Albany Bank & Trust Company Na
Bought by
Marcinkowski Peter A and Marcinkowski Eva Mori
Home Financials for this Owner
Home Financials are based on the most recent Mortgage that was taken out on this home.
Original Mortgage
$62,000
Interest Rate
6.87%
Create a Home Valuation Report for This Property
The Home Valuation Report is an in-depth analysis detailing your home's value as well as a comparison with similar homes in the area
Home Values in the Area
Average Home Value in this Area
Purchase History
| Date | Buyer | Sale Price | Title Company |
|---|---|---|---|
| Marcinkowska Ewa Mori | -- | None Available | |
| Mori Marcinkowski Ewa | -- | -- | |
| Marcinkowski Peter A | $117,000 | -- |
Source: Public Records
Mortgage History
| Date | Status | Borrower | Loan Amount |
|---|---|---|---|
| Open | Mori Marcinkowski Ewa | $64,000 | |
| Previous Owner | Marcinkowski Peter A | $62,000 |
Source: Public Records
Tax History Compared to Growth
Tax History
| Year | Tax Paid | Tax Assessment Tax Assessment Total Assessment is a certain percentage of the fair market value that is determined by local assessors to be the total taxable value of land and additions on the property. | Land | Improvement |
|---|---|---|---|---|
| 2024 | $1,187 | $23,155 | $4,500 | $18,655 |
| 2023 | $4,010 | $24,000 | $4,500 | $19,500 |
| 2022 | $4,010 | $24,000 | $4,500 | $19,500 |
| 2021 | $1,316 | $20,521 | $1,242 | $19,279 |
| 2020 | $1,195 | $20,521 | $1,242 | $19,279 |
| 2019 | $1,171 | $23,031 | $1,242 | $21,789 |
| 2018 | $1,363 | $15,210 | $1,026 | $14,184 |
| 2017 | $1,306 | $15,210 | $1,026 | $14,184 |
| 2016 | $1,804 | $15,210 | $1,026 | $14,184 |
| 2015 | $2,055 | $12,567 | $891 | $11,676 |
| 2014 | $3,046 | $14,710 | $891 | $13,819 |
| 2013 | $2,969 | $14,710 | $891 | $13,819 |
Source: Public Records
Map
Nearby Homes
- 4937 N Ozanam Ave
- 4621 N Ozanam Ave
- 7650 W Lawrence Ave Unit 201
- 7641 W Ainslie St
- 4617 N Canfield Ave
- 7616 W Lawrence Ave Unit 3A
- 8025 W Giddings St
- 7632 W Norridge St
- 7604 W Lawrence Ave Unit 1B
- 5134 N Mission Dr
- 7636 W Strong St
- 4846 N Crescent Ave
- 5161 N Moreland Ave
- 8024 W Charmaine Rd
- 4436 N Osage Ave
- 8200 W Eastwood Ave
- 7519 W Argyle St
- 4811 N Olcott Ave Unit 307
- 4404 N Opal Ave
- 7502 W Strong St
- 7862 W Lawrence Ave
- 7862 W Lawrence Ave
- 7862 W Lawrence Ave
- 7862 W Lawrence Ave
- 7862 W Lawrence Ave
- 7862 W Lawrence Ave
- 7862 W Lawrence Ave Unit B
- 7862 W Lawrence Ave Unit D
- 7862 W Lawrence Ave Unit E
- 7862 W Lawrence Ave Unit F
- 7900 W Lawrence Ave
- 7900 W Lawrence Ave
- 7900 W Lawrence Ave
- 7900 W Lawrence Ave
- 7900 W Lawrence Ave
- 7900 W Lawrence Ave
- 7900 W Lawrence Ave Unit C
- 7900 W Lawrence Ave Unit 7900
- 7900 W Lawrence Ave Unit D
- 7856 W Lawrence Ave