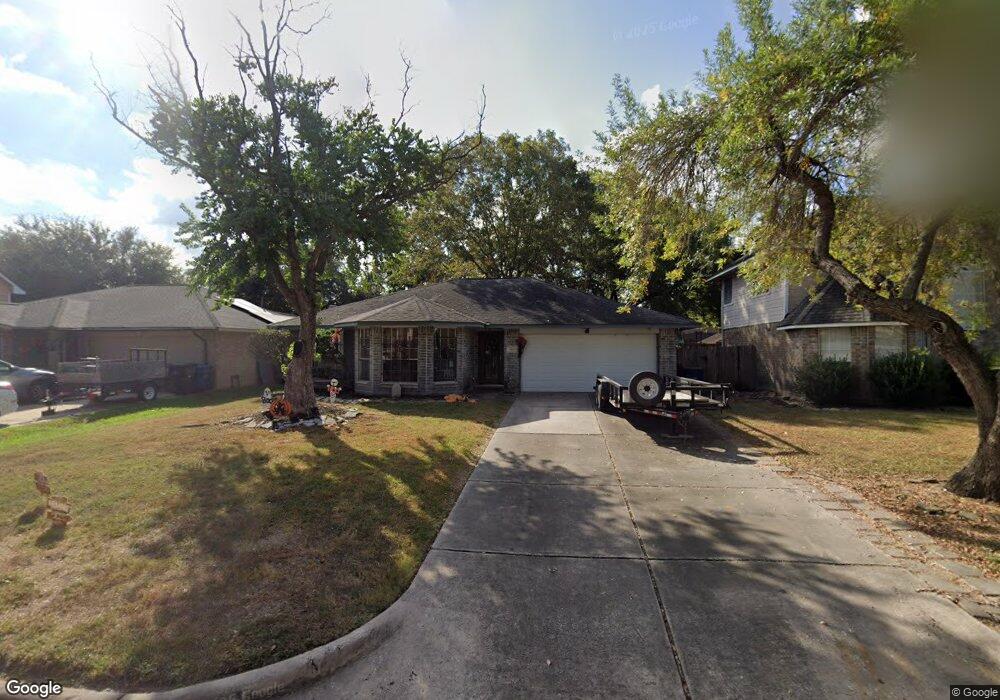
7863 Yellow Pine Dr Houston, TX 77040
North Houston NeighborhoodEstimated Value: $226,546 - $245,000
3
Beds
2
Baths
1,488
Sq Ft
$160/Sq Ft
Est. Value
About This Home
This home is located at 7863 Yellow Pine Dr, Houston, TX 77040 and is currently estimated at $238,637, approximately $160 per square foot. 7863 Yellow Pine Dr is a home located in Harris County with nearby schools including Reed Elementary School, Dean Middle School, and Jersey Village High School.
Ownership History
Date
Name
Owned For
Owner Type
Purchase Details
Closed on
Apr 28, 2014
Sold by
Guerrero Oscar
Bought by
Homero Rodngnez Bellvida Custem Homes Ll
Current Estimated Value
Purchase Details
Closed on
May 31, 2001
Sold by
Tschatschula Randy P and Tschatschula Michelle D
Bought by
Perez Melissa L
Home Financials for this Owner
Home Financials are based on the most recent Mortgage that was taken out on this home.
Original Mortgage
$58,500
Interest Rate
8.62%
Purchase Details
Closed on
Sep 23, 1997
Sold by
Annis Paul L and Annis Dana R
Bought by
Tschatschula Randy P and Tschatschula Michelle D
Home Financials for this Owner
Home Financials are based on the most recent Mortgage that was taken out on this home.
Original Mortgage
$70,501
Interest Rate
7.27%
Mortgage Type
FHA
Create a Home Valuation Report for This Property
The Home Valuation Report is an in-depth analysis detailing your home's value as well as a comparison with similar homes in the area
Home Values in the Area
Average Home Value in this Area
Purchase History
| Date | Buyer | Sale Price | Title Company |
|---|---|---|---|
| Homero Rodngnez Bellvida Custem Homes Ll | -- | None Available | |
| Perez Melissa L | -- | First American Title | |
| Tschatschula Randy P | -- | American Title Co |
Source: Public Records
Mortgage History
| Date | Status | Borrower | Loan Amount |
|---|---|---|---|
| Previous Owner | Perez Melissa L | $58,500 | |
| Previous Owner | Tschatschula Randy P | $70,501 |
Source: Public Records
Tax History Compared to Growth
Tax History
| Year | Tax Paid | Tax Assessment Tax Assessment Total Assessment is a certain percentage of the fair market value that is determined by local assessors to be the total taxable value of land and additions on the property. | Land | Improvement |
|---|---|---|---|---|
| 2025 | $2,099 | $208,766 | $54,452 | $154,314 |
| 2024 | $2,099 | $221,424 | $54,452 | $166,972 |
| 2023 | $2,099 | $215,885 | $54,452 | $161,433 |
| 2022 | $3,509 | $200,987 | $49,619 | $151,368 |
| 2021 | $3,356 | $161,684 | $49,619 | $112,065 |
| 2020 | $3,143 | $151,956 | $35,249 | $116,707 |
| 2019 | $2,965 | $132,627 | $24,170 | $108,457 |
| 2018 | $1,068 | $129,401 | $24,170 | $105,231 |
| 2017 | $2,520 | $129,401 | $24,170 | $105,231 |
| 2016 | $2,291 | $123,192 | $20,142 | $103,050 |
| 2015 | $1,324 | $123,192 | $20,142 | $103,050 |
| 2014 | $1,324 | $84,654 | $10,260 | $74,394 |
Source: Public Records
Map
Nearby Homes
- 7823 Lumber Jack Dr
- 7803 Yellow Pine Dr
- 7707 Lumber Jack Dr
- 7727 Log Hollow Dr
- 7606 Battlepine Dr
- 7918 Battleoak Dr
- 7911 Battleoak Dr
- 8006 Summer Trail Dr
- 7706 Deadwood Dr
- 10515 Ince Ln
- 7731 Deadwood Dr
- 7410 Log Hollow Dr
- 7706 Cloverlake Ct
- 7322 Sawmill Trail
- 7926 Westington Ln
- 7210 Lumber Jack Dr
- 8115 Oahu Ct
- 7410 Wood Bluff Blvd
- 7311 Woodoak Dr
- 9523 Vanwood St
- 7859 Yellow Pine Dr
- 7867 Yellow Pine Dr
- 7855 Yellow Pine Dr
- 7871 Yellow Pine Dr
- 7862 Lumber Jack Dr
- 7858 Lumber Jack Dr
- 7866 Lumber Jack Dr
- 7854 Lumber Jack Dr
- 7851 Yellow Pine Dr
- 7870 Lumber Jack Dr
- 7875 Yellow Pine Dr
- 7862 Yellow Pine Dr
- 7866 Yellow Pine Dr
- 7858 Yellow Pine Dr
- 7850 Lumber Jack Dr
- 7870 Yellow Pine Dr
- 7854 Yellow Pine Dr
- 7874 Lumber Jack Dr
- 7847 Yellow Pine Dr
- 7874 Yellow Pine Dr