7864 Red Rock Dr Fowlerville, MI 48836
Estimated Value: $261,000 - $351,636
3
Beds
2
Baths
1,336
Sq Ft
$237/Sq Ft
Est. Value
About This Home
This home is located at 7864 Red Rock Dr, Fowlerville, MI 48836 and is currently estimated at $316,909, approximately $237 per square foot. 7864 Red Rock Dr is a home located in Livingston County with nearby schools including H.T. Smith Elementary School, Natalie Kreeger Elementary School, and Fowlerville Junior High School.
Ownership History
Date
Name
Owned For
Owner Type
Purchase Details
Closed on
Dec 3, 2013
Sold by
Turner Deborah A and Turner Deborah
Bought by
Turner Deborah A
Current Estimated Value
Purchase Details
Closed on
Sep 30, 2011
Sold by
Fannie Mae
Bought by
Turner Deborah
Purchase Details
Closed on
Jun 15, 2010
Sold by
Bac Home Loans Servicing Lp
Bought by
Fannie Mae
Purchase Details
Closed on
May 26, 2010
Sold by
Nakoneczny David C and Nakoneczny Kathleen M
Bought by
Bac Home Loans Servicing Lp
Purchase Details
Closed on
Sep 1, 1999
Sold by
James Mills Construction Inc
Bought by
Nakoneczny David C and Nakoneczny Kathleen M
Home Financials for this Owner
Home Financials are based on the most recent Mortgage that was taken out on this home.
Original Mortgage
$117,900
Interest Rate
8.21%
Purchase Details
Closed on
Feb 19, 1999
Sold by
Mills James R and Mills Susan K
Bought by
James Mills Construction Co Inc
Create a Home Valuation Report for This Property
The Home Valuation Report is an in-depth analysis detailing your home's value as well as a comparison with similar homes in the area
Home Values in the Area
Average Home Value in this Area
Purchase History
| Date | Buyer | Sale Price | Title Company |
|---|---|---|---|
| Turner Deborah A | -- | -- | |
| Turner Deborah | $113,000 | -- | |
| Fannie Mae | -- | -- | |
| Bac Home Loans Servicing Lp | $142,931 | -- | |
| Nakoneczny David C | $147,900 | American Title Co | |
| James Mills Construction Co Inc | -- | -- |
Source: Public Records
Mortgage History
| Date | Status | Borrower | Loan Amount |
|---|---|---|---|
| Previous Owner | Nakoneczny David C | $117,900 |
Source: Public Records
Tax History Compared to Growth
Tax History
| Year | Tax Paid | Tax Assessment Tax Assessment Total Assessment is a certain percentage of the fair market value that is determined by local assessors to be the total taxable value of land and additions on the property. | Land | Improvement |
|---|---|---|---|---|
| 2025 | $2,267 | $147,746 | $0 | $0 |
| 2024 | $1,008 | $129,506 | $0 | $0 |
| 2023 | $963 | $128,252 | $0 | $0 |
| 2022 | $2,009 | $118,655 | $0 | $0 |
| 2021 | $1,984 | $102,610 | $0 | $0 |
| 2020 | $1,987 | $105,460 | $0 | $0 |
| 2019 | $1,917 | $95,930 | $0 | $0 |
| 2018 | $1,880 | $85,540 | $0 | $0 |
| 2017 | $1,933 | $85,540 | $0 | $0 |
| 2016 | $1,919 | $79,770 | $0 | $0 |
| 2014 | $2,652 | $64,900 | $0 | $0 |
| 2012 | $2,652 | $64,470 | $0 | $0 |
Source: Public Records
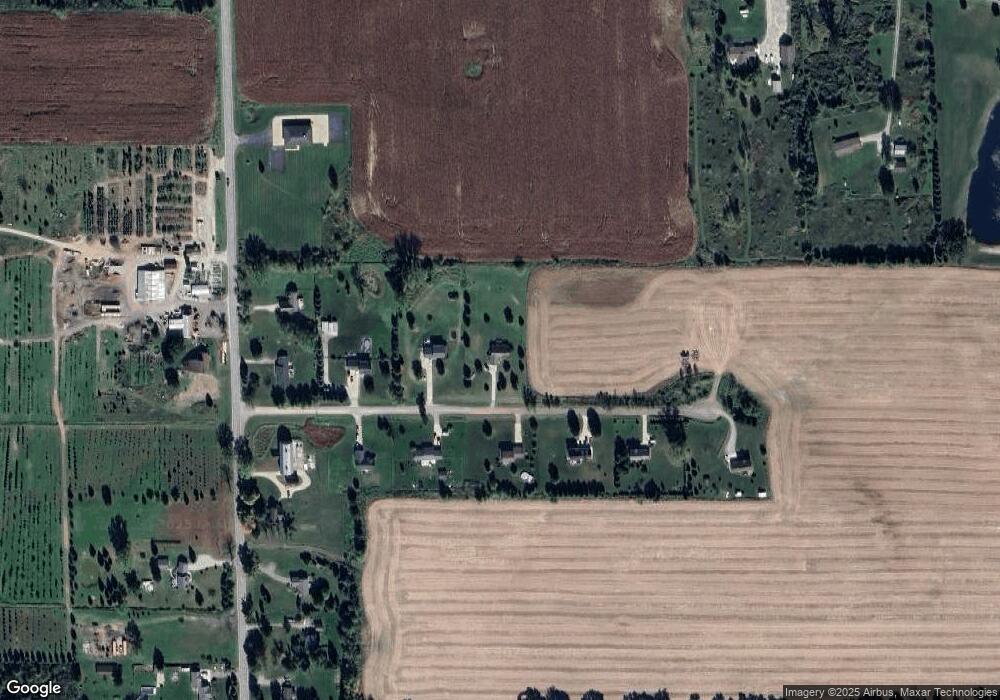
Map
Nearby Homes
- 625 Fowlerville Rd
- 00 Fowlerville Rd
- 9131 Judd Rd
- 6111 Sargent Rd
- 7988 Layton Rd
- 1088 Kern Rd
- 8582 Pinnebog River Dr
- 2735 Au Gres River Dr
- 8680 Chippewa River Dr
- 323 S Truhn Rd
- Lot 100 Sycamore River Dr
- Lot 99 Sycamore River Dr
- 7024 Lange Rd
- 8586 Cass River Dr
- 00 Country Corner Dr
- 8351 Lange Rd
- 881 Oakhurst Rd
- 963 S Grand Ave
- 3388 Hogback Rd
- 1019 River Line Dr Unit 396
- 7900 Red Rock Dr
- 0 Red Rock Dr Unit 4960561
- 7841 Red Rock Dr
- 7803 Red Rock Dr
- 7879 Red Rock Dr
- 7917 Red Rock Dr
- 7765 Red
- 000 Red Rock Dr
- 7765 Red Rock Dr
- 680 Fowlerville Rd
- 736 Fowlerville Rd
- 600 Fowlerville Rd
- 7727 Red Rock Dr
- 580 Fowlerville Rd
- 687 Fowlerville Rd
- 544 Fowlerville Rd
- 7655 Sargent Rd
- 7741 Sargent Rd
- 520 Fowlerville Rd
- 7958 Colleen Dr