Estimated Value: $380,000 - $444,000
3
Beds
1
Bath
810
Sq Ft
$501/Sq Ft
Est. Value
About This Home
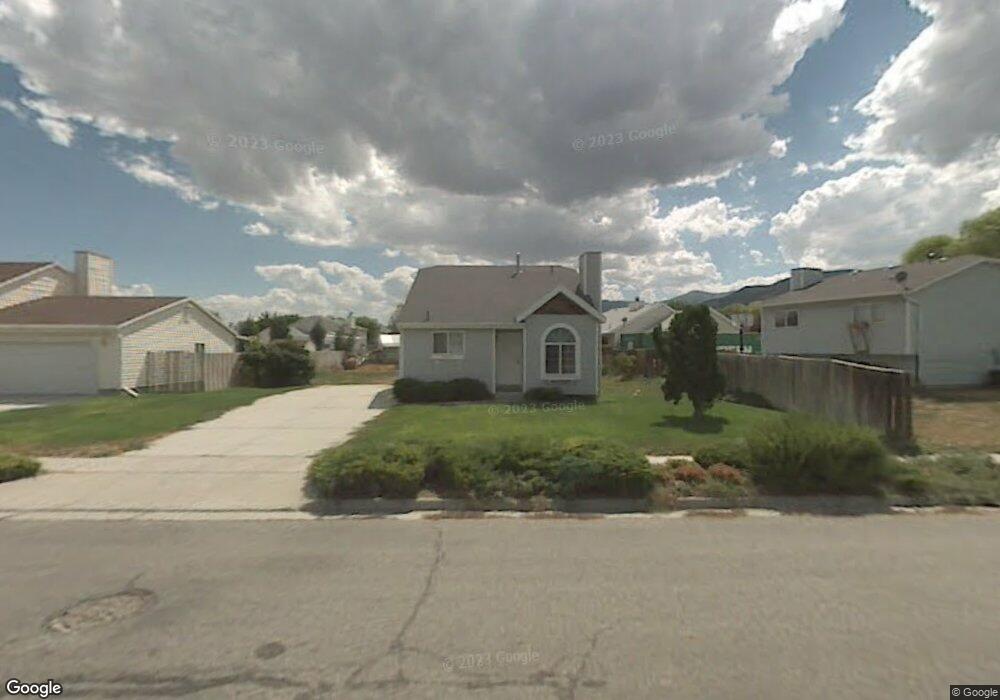
This home is located at 7865 Dalesend Dr, Magna, UT 84044 and is currently estimated at $405,625, approximately $500 per square foot. 7865 Dalesend Dr is a home located in Salt Lake County with nearby schools including Pleasant Green Elementary School, Matheson Junior High School, and Cyprus High School.
Ownership History
Date
Name
Owned For
Owner Type
Purchase Details
Closed on
Sep 25, 2015
Sold by
Hall Joseph P
Bought by
Chan V Timothy and Chan Jane S
Current Estimated Value
Home Financials for this Owner
Home Financials are based on the most recent Mortgage that was taken out on this home.
Original Mortgage
$149,737
Outstanding Balance
$117,289
Interest Rate
3.75%
Mortgage Type
FHA
Estimated Equity
$288,336
Purchase Details
Closed on
Mar 11, 2008
Sold by
Hall Joseph Ben
Bought by
Hall Joseph P
Home Financials for this Owner
Home Financials are based on the most recent Mortgage that was taken out on this home.
Original Mortgage
$135,867
Interest Rate
5.65%
Mortgage Type
FHA
Purchase Details
Closed on
Sep 19, 2000
Sold by
Hall Sandra P
Bought by
Hall Joseph Ben
Create a Home Valuation Report for This Property
The Home Valuation Report is an in-depth analysis detailing your home's value as well as a comparison with similar homes in the area
Home Values in the Area
Average Home Value in this Area
Purchase History
| Date | Buyer | Sale Price | Title Company |
|---|---|---|---|
| Chan V Timothy | -- | Affiliated First Title | |
| Hall Joseph P | -- | Affiliated First Title | |
| Hall Joseph Ben | -- | -- |
Source: Public Records
Mortgage History
| Date | Status | Borrower | Loan Amount |
|---|---|---|---|
| Open | Chan V Timothy | $149,737 | |
| Previous Owner | Hall Joseph P | $135,867 |
Source: Public Records
Tax History Compared to Growth
Tax History
| Year | Tax Paid | Tax Assessment Tax Assessment Total Assessment is a certain percentage of the fair market value that is determined by local assessors to be the total taxable value of land and additions on the property. | Land | Improvement |
|---|---|---|---|---|
| 2025 | $2,625 | $359,600 | $95,500 | $264,100 |
| 2024 | $2,625 | $349,400 | $93,300 | $256,100 |
| 2023 | $2,529 | $322,800 | $89,800 | $233,000 |
| 2022 | $2,479 | $313,700 | $88,000 | $225,700 |
| 2021 | $2,277 | $257,600 | $67,700 | $189,900 |
| 2020 | $2,138 | $224,600 | $57,800 | $166,800 |
| 2019 | $2,010 | $214,200 | $54,500 | $159,700 |
| 2018 | $1,958 | $196,400 | $54,500 | $141,900 |
| 2017 | $1,636 | $171,100 | $54,500 | $116,600 |
| 2016 | $1,413 | $151,500 | $53,600 | $97,900 |
| 2015 | $1,345 | $135,500 | $65,100 | $70,400 |
| 2014 | $1,286 | $126,100 | $61,200 | $64,900 |
Source: Public Records
Map
Nearby Homes
- 2924 S 7890 W
- 2903 S 7930 W
- Donovan Plan at Gabler's Grove - Cottages
- 2100 Craftsman Plan at Gabler's Grove - Collection
- 2050 Craftsman Plan at Gabler's Grove - Cottages
- Carson Plan at Gabler's Grove - Cottages
- Sanders Plan at Gabler's Grove - Cottages
- 2050 Craftsman Plan at Gabler's Grove - Collection
- Pasadena Plan at Gabler's Grove - Cottages
- Parksdale Plan at Gabler's Grove - Collection
- Randall Plan at Gabler's Grove - Cottages
- 7816 W 2820 S
- 7873 W 3060 S
- 2857 S 7740 W
- 7817 W Range Creek Ln
- 2846 Adam Hill Way
- 7753 W Range Creek Ln
- 7794 W Marwari Rd
- 7774 W Marwari Rd
- 2668 S Sinbad Way
- 7865 W Dalesend Dr
- 7855 Dalesend Dr
- 2909 Ropner Cir
- 2919 Ropner Cir
- 2919 S Ropner Cir
- 2888 S Berkshire Cir
- 7847 Dalesend Dr
- 2931 Ropner Cir
- 2931 S Ropner Cir
- 2888 Berkshire Cir
- 2891 Berkshire Cir
- 7858 Ohara Cir
- 2876 S 7865 W
- 2918 S Ropner Cir
- 2943 Ropner Cir
- 7833 Dalesend Dr
- 7858 W Ohara Cir
- 2918 Ropner Cir
- 7852 W Ohara Cir
- 2906 Ropner Cir