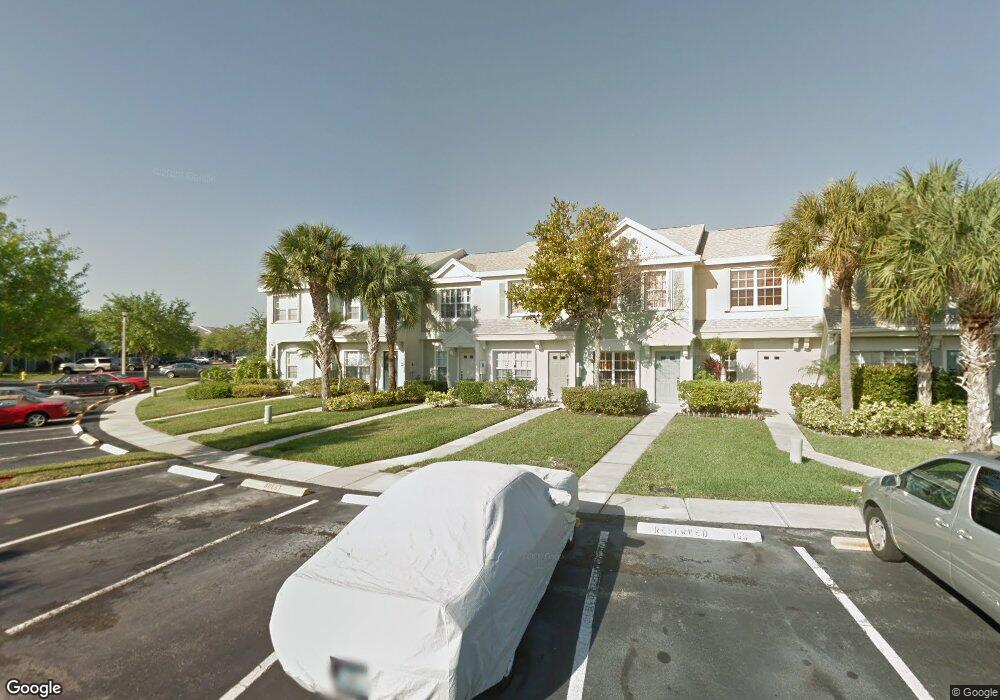
7865 Dixie Beach Cir Tamarac, FL 33321
Estimated Value: $280,969 - $304,000
2
Beds
2
Baths
1,073
Sq Ft
$272/Sq Ft
Est. Value
About This Home
This home is located at 7865 Dixie Beach Cir, Tamarac, FL 33321 and is currently estimated at $292,242, approximately $272 per square foot. 7865 Dixie Beach Cir is a home located in Broward County with nearby schools including Challenger Elementary School, Millennium 6-12 Collegiate Academy, and J. P. Taravella High School.
Ownership History
Date
Name
Owned For
Owner Type
Purchase Details
Closed on
Feb 12, 2020
Sold by
Avanti Developments Llc
Bought by
Mantione Travis and Mantione Robert
Current Estimated Value
Home Financials for this Owner
Home Financials are based on the most recent Mortgage that was taken out on this home.
Original Mortgage
$180,500
Outstanding Balance
$158,832
Interest Rate
3.72%
Mortgage Type
New Conventional
Estimated Equity
$133,410
Purchase Details
Closed on
Dec 8, 2011
Sold by
Nagel Yamil
Bought by
Avanti Developments Llc
Purchase Details
Closed on
Aug 10, 2011
Sold by
The Bank Of New York Mellon
Bought by
Magel Yamil
Purchase Details
Closed on
Jun 14, 2011
Sold by
Gomez Maria
Bought by
Bank Of New York Mellon
Purchase Details
Closed on
Mar 23, 2000
Sold by
Chinquee Shelley C
Bought by
Gomez Maria
Purchase Details
Closed on
Dec 21, 1994
Sold by
Pulte Home Corp
Bought by
Chinque Shelley C
Create a Home Valuation Report for This Property
The Home Valuation Report is an in-depth analysis detailing your home's value as well as a comparison with similar homes in the area
Home Values in the Area
Average Home Value in this Area
Purchase History
| Date | Buyer | Sale Price | Title Company |
|---|---|---|---|
| Mantione Travis | $190,000 | Seabreeze Title Llc | |
| Avanti Developments Llc | -- | Attorney | |
| Magel Yamil | $80,500 | First American Title | |
| Bank Of New York Mellon | $48,700 | None Available | |
| Gomez Maria | $74,600 | -- | |
| Chinque Shelley C | $71,900 | -- |
Source: Public Records
Mortgage History
| Date | Status | Borrower | Loan Amount |
|---|---|---|---|
| Open | Mantione Travis | $180,500 |
Source: Public Records
Tax History Compared to Growth
Tax History
| Year | Tax Paid | Tax Assessment Tax Assessment Total Assessment is a certain percentage of the fair market value that is determined by local assessors to be the total taxable value of land and additions on the property. | Land | Improvement |
|---|---|---|---|---|
| 2026 | $5,105 | $242,160 | -- | -- |
| 2025 | $4,950 | $242,160 | -- | -- |
| 2024 | $4,849 | $235,340 | $15,280 | $213,210 |
| 2023 | $4,849 | $228,490 | $15,280 | $213,210 |
| 2022 | $4,585 | $222,710 | $15,280 | $207,430 |
| 2021 | $4,399 | $169,770 | $16,810 | $152,960 |
| 2020 | $3,940 | $165,370 | $16,810 | $148,560 |
| 2019 | $3,697 | $154,360 | $16,810 | $137,550 |
| 2018 | $3,380 | $139,230 | $16,810 | $122,420 |
| 2017 | $3,180 | $105,950 | $0 | $0 |
| 2016 | $2,998 | $96,320 | $0 | $0 |
| 2015 | $2,769 | $87,570 | $0 | $0 |
| 2014 | $2,593 | $79,610 | $0 | $0 |
| 2013 | -- | $72,380 | $16,810 | $55,570 |
Source: Public Records
Map
Nearby Homes
- 7858 Dixie Beach Cir Unit 7858
- 8251 San Carlos Cir Unit 230
- 8040 Sanibel Dr
- 7886 Dixie Beach Cir Unit 7886
- 7938 Sanibel Dr
- 7882 Trent Dr Unit 310
- 7852 Trent Dr Unit 206
- 7711 Sanibel Dr
- 7840 Trent Dr Unit 111
- 7780 Trent Dr Unit 307
- 7802 Trent Dr Unit 406
- 7711 Trent Dr Unit 106
- 8121 San Carlos Cir
- 7967 Exeter Blvd W Unit 203
- 7972 Exeter Blvd W Unit 101
- 7702 Trent Dr Unit 408
- 7676 Trent Dr Unit 308
- 8066 Sanibel Dr Unit 8066
- 7562 Trent Dr Unit 306
- 7572 Trent Dr Unit 311
- 7865 Dixie Beach Cir Unit 7865
- 7863 Dixie Beach Cir
- 7867 Dixie Beach Cir Unit 152
- 7869 Dixie Beach Cir
- 7861 Dixie Beach Cir Unit 149
- 7873 Dixie Beach Cir
- 7875 Dixie Beach Cir Unit 156
- 7845 Dixie Beach Cir
- 7841 Dixie Beach Cr Unit 7841
- 7841 Dixie Beach Cr Unit 146
- 7841 Dixie Beach Cir
- 7860 Sanibel Dr
- 7858 Sanibel Dr
- 7862 Sanibel Dr Unit 121
- 7839 7839 Dixie Beach Cir # 7839 Unit 7839
- 7864 Sanibel Dr Unit 120
- 7866 Sanibel Dr