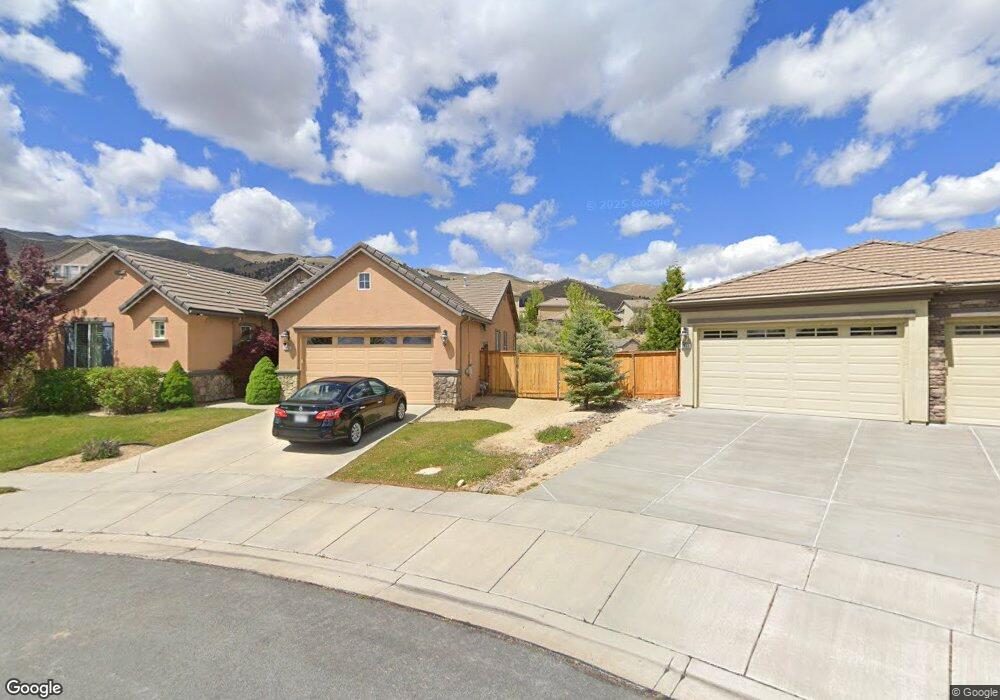
7865 Peavine Trail Ct Reno, NV 89523
Northgate NeighborhoodEstimated Value: $750,409 - $825,000
3
Beds
2
Baths
2,143
Sq Ft
$373/Sq Ft
Est. Value
About This Home
This home is located at 7865 Peavine Trail Ct, Reno, NV 89523 and is currently estimated at $800,352, approximately $373 per square foot. 7865 Peavine Trail Ct is a home located in Washoe County with nearby schools including Rollan D. Melton Elementary School, B D Billinghurst Middle School, and Robert McQueen High School.
Ownership History
Date
Name
Owned For
Owner Type
Purchase Details
Closed on
Feb 4, 2011
Sold by
Fannie Mae
Bought by
Nielson Grant and Nielson Terri
Current Estimated Value
Home Financials for this Owner
Home Financials are based on the most recent Mortgage that was taken out on this home.
Original Mortgage
$205,500
Outstanding Balance
$139,882
Interest Rate
4.67%
Mortgage Type
New Conventional
Estimated Equity
$660,470
Purchase Details
Closed on
Aug 11, 2010
Sold by
Ballman Brett T and Ballman Krista C
Bought by
Fannie Mae and Federal National Mortgage Association
Purchase Details
Closed on
Sep 26, 2006
Sold by
Lakemont Canyon Pines Llc
Bought by
Ballman Brett T and Ballman Krista C
Home Financials for this Owner
Home Financials are based on the most recent Mortgage that was taken out on this home.
Original Mortgage
$402,805
Interest Rate
6.51%
Mortgage Type
Unknown
Create a Home Valuation Report for This Property
The Home Valuation Report is an in-depth analysis detailing your home's value as well as a comparison with similar homes in the area
Home Values in the Area
Average Home Value in this Area
Purchase History
| Date | Buyer | Sale Price | Title Company |
|---|---|---|---|
| Nielson Grant | $257,000 | Northern Nevada Title Cc | |
| Fannie Mae | $443,291 | Accommodation | |
| Ballman Brett T | $504,000 | First American Title |
Source: Public Records
Mortgage History
| Date | Status | Borrower | Loan Amount |
|---|---|---|---|
| Open | Nielson Grant | $205,500 | |
| Previous Owner | Ballman Brett T | $402,805 |
Source: Public Records
Tax History Compared to Growth
Tax History
| Year | Tax Paid | Tax Assessment Tax Assessment Total Assessment is a certain percentage of the fair market value that is determined by local assessors to be the total taxable value of land and additions on the property. | Land | Improvement |
|---|---|---|---|---|
| 2025 | $5,473 | $165,871 | $49,511 | $116,360 |
| 2024 | $5,473 | $164,074 | $47,047 | $117,027 |
| 2023 | $5,067 | $162,984 | $52,283 | $110,701 |
| 2022 | $4,694 | $135,500 | $43,428 | $92,072 |
| 2021 | $4,348 | $122,576 | $31,185 | $91,391 |
| 2020 | $4,087 | $125,235 | $33,803 | $91,432 |
| 2019 | $3,893 | $121,594 | $33,611 | $87,983 |
| 2018 | $3,780 | $113,058 | $27,027 | $86,031 |
| 2017 | $3,671 | $110,768 | $24,794 | $85,974 |
| 2016 | $3,577 | $108,533 | $20,829 | $87,704 |
| 2015 | $3,510 | $108,200 | $22,754 | $85,446 |
| 2014 | $3,408 | $100,992 | $18,480 | $82,512 |
| 2013 | -- | $91,931 | $15,362 | $76,569 |
Source: Public Records
Map
Nearby Homes
- 2265 Peavine Valley Rd
- 2440 Mountain Spirit Trail
- 2650 Peavine Creek Rd
- 2450 Painted River Trail
- 7325 Heritage Oaks Dr
- 2155 Hunter Glen Ct
- 2720 Peavine Pines Ct
- 2595 Drake Wood Ct
- 8175 Fox Meadows Ct
- 7210 Heritage Oaks Dr
- 2195 Candle Rock Ct
- 7621 Autumn Ridge Cir
- 2350 Glen Eagles Dr
- 2395 Ridge Field Trail
- 8200 Antler Pointe Ct
- 7135 Windstar Dr
- 7867 Morgan Pointe Cir
- 2835 Sandestin Dr
- 8310 Cinnamon Ridge Ln
- 1672 Spring Hill Dr
- 7875 Peavine Trail Ct
- 7855 Peavine Trail Ct
- 7780 Great Basin Rd
- 7770 Great Basin Rd
- 7885 Peavine Trail Ct
- 7760 Great Basin Rd
- 7790 Great Basin Rd
- 7850 Peavine Trail Ct
- 7850 Peavine Trail Ct Unit Peavine Trail
- 7770 Peavine Shadow Ct
- 7765 Peavine Shadow Ct
- 7750 Great Basin Rd
- 7798 Great Basin Rd
- 7740 Great Basin Rd
- 7895 Peavine Trail Ct
- 7860 Peavine Trail Ct
- 7870 Peavine Trail Ct
- 7760 Peavine Shadow Ct
- 7755 Peavine Shadow Ct
- 7880 Peavine Trail Ct