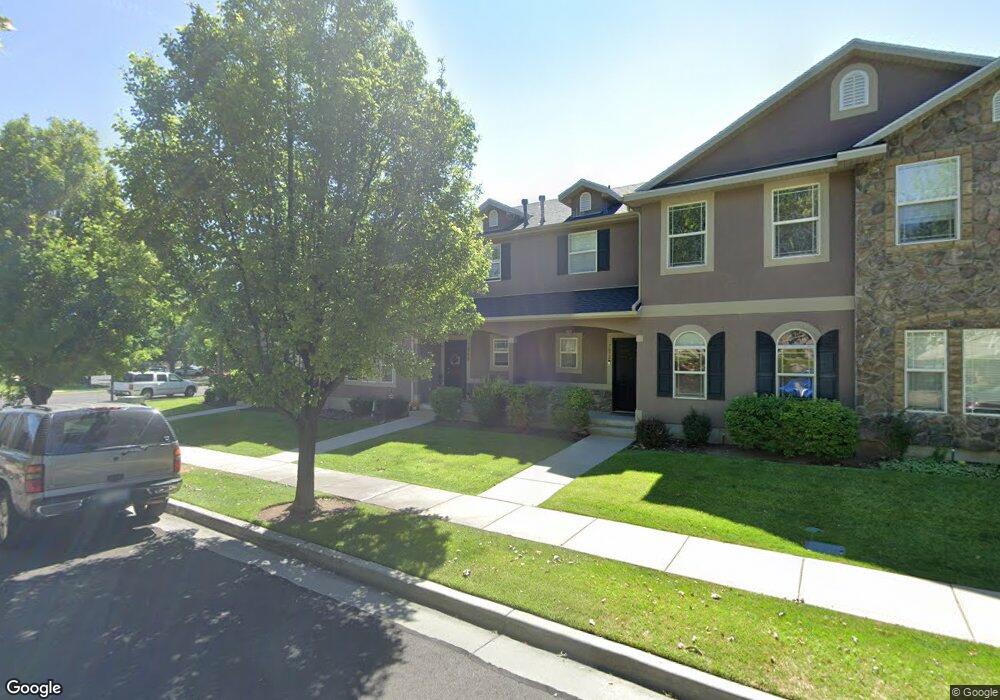
7868 S Dove Creek Ln West Jordan, UT 84081
Cobble Creek NeighborhoodEstimated Value: $389,918 - $401,000
3
Beds
3
Baths
1,421
Sq Ft
$279/Sq Ft
Est. Value
About This Home
This home is located at 7868 S Dove Creek Ln, West Jordan, UT 84081 and is currently estimated at $396,980, approximately $279 per square foot. 7868 S Dove Creek Ln is a home located in Salt Lake County with nearby schools including Hayden Peak Elementary School, West Hills Middle School, and Copper Hills High School.
Ownership History
Date
Name
Owned For
Owner Type
Purchase Details
Closed on
Jun 20, 2024
Sold by
Cifuentes David A and Cifuentes Maricela
Bought by
Gulbransen David Gean and Gulbransen Sha Maine
Current Estimated Value
Home Financials for this Owner
Home Financials are based on the most recent Mortgage that was taken out on this home.
Original Mortgage
$392,755
Outstanding Balance
$387,960
Interest Rate
7.25%
Mortgage Type
FHA
Estimated Equity
$9,020
Purchase Details
Closed on
Aug 24, 2017
Sold by
Dorff David L and Dorff Anne H
Bought by
Cifuentes David A and Cifuentes Maricola
Home Financials for this Owner
Home Financials are based on the most recent Mortgage that was taken out on this home.
Original Mortgage
$202,268
Interest Rate
5.12%
Mortgage Type
FHA
Purchase Details
Closed on
Aug 7, 2007
Sold by
Sutton Richard and Sutton Shelly
Bought by
Dorff David L and Dorff Anne H
Purchase Details
Closed on
May 30, 2003
Sold by
Kfp Corp
Bought by
Sutton Richard and Sutton Shelly
Create a Home Valuation Report for This Property
The Home Valuation Report is an in-depth analysis detailing your home's value as well as a comparison with similar homes in the area
Home Values in the Area
Average Home Value in this Area
Purchase History
| Date | Buyer | Sale Price | Title Company |
|---|---|---|---|
| Gulbransen David Gean | -- | P1 Title Insurance Agency | |
| Cifuentes David A | -- | Artisan Title | |
| Dorff David L | -- | Wasatch Title Ins Agency Llc | |
| Sutton Richard | -- | Meridian Title |
Source: Public Records
Mortgage History
| Date | Status | Borrower | Loan Amount |
|---|---|---|---|
| Open | Gulbransen David Gean | $392,755 | |
| Closed | Gulbransen David Gean | $23,565 | |
| Previous Owner | Cifuentes David A | $202,268 |
Source: Public Records
Tax History Compared to Growth
Tax History
| Year | Tax Paid | Tax Assessment Tax Assessment Total Assessment is a certain percentage of the fair market value that is determined by local assessors to be the total taxable value of land and additions on the property. | Land | Improvement |
|---|---|---|---|---|
| 2025 | $1,863 | $381,200 | $114,300 | $266,900 |
| 2024 | $1,863 | $358,500 | $107,500 | $251,000 |
| 2023 | $1,909 | $346,100 | $103,800 | $242,300 |
| 2022 | $1,951 | $348,000 | $104,400 | $243,600 |
| 2021 | $1,597 | $259,300 | $77,800 | $181,500 |
| 2020 | $1,531 | $233,400 | $70,000 | $163,400 |
| 2019 | $1,457 | $217,800 | $65,300 | $152,500 |
| 2018 | $1,349 | $200,000 | $60,000 | $140,000 |
| 2017 | $1,193 | $176,100 | $52,800 | $123,300 |
| 2016 | $1,156 | $160,300 | $48,100 | $112,200 |
| 2015 | $1,128 | $152,500 | $45,800 | $106,700 |
| 2014 | $1,134 | $151,000 | $45,300 | $105,700 |
Source: Public Records
Map
Nearby Homes
- 7882 S Dove Creek Ln Unit A6
- 7908 Cold Stone Ln Unit N3
- 5189 W Dove Creek Ln
- 5228 W Ranches Loop Rd
- 5183 W Swift Water Way
- 5298 W Icehouse Way
- 7877 S 5440 W Unit 119
- 5422 W Island Creek Dr
- 8322 Copper Vista Cir
- 7414 Regal Hill Dr
- 4678 Emmons Dr
- 7563 S Opal Mountain Way W Unit 306
- 7567 S Opal Mountain Way W Unit 307
- 7556 S Opal Mountain Way W Unit 311
- 7569 S Opal Mountain Way W Unit 308
- 7554 S Opal Mountain Way W Unit 310
- 7553 S Opal Mountain Way W Unit 302
- 8441 S Spratling Dr
- 7903 Mckenzie Ln
- 7886 Mckenzie Ln
- 7868 Dove Creek Ln
- 7864 Dove Creek Ln
- 7872 Dove Creek Ln Unit A3
- 7872 S Dove Creek Ln
- 7876 S Dove Creek Ln
- 7876 Dove Creek Ln
- 7878 Dove Creek Ln
- 7878 S Dove Creek Ln
- 5182 W Cold Stone Ln
- 5182 Cold Stone Ln
- 7882 Dove Creek Ln Unit A6
- 7882 S Dove Creek Ln
- 5174 W Cold Stone Ln
- 5174 Cold Stone Ln
- 7891 S Dove Creek Ln
- 7891 Dove Creek Ln Unit K1
- 5168 W Cold Stone Ln
- 7889 S Dove Creek Ln
- 7889 Dove Creek Ln
- 7857 Cool Creek Way