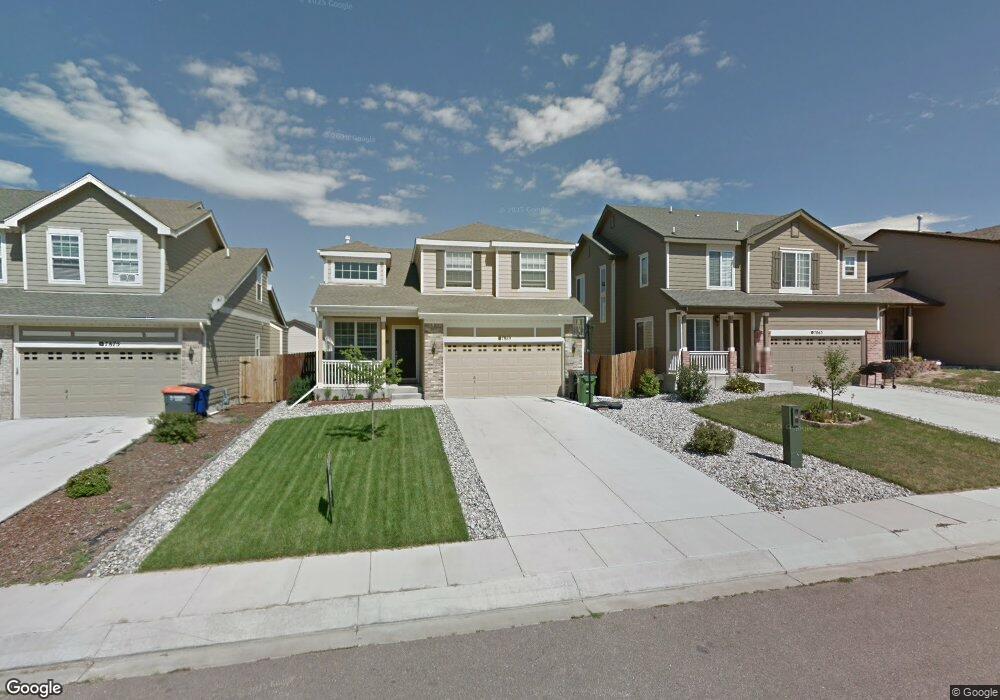
7869 Parsonage Ln Colorado Springs, CO 80951
Estimated Value: $440,513 - $451,000
4
Beds
3
Baths
1,752
Sq Ft
$254/Sq Ft
Est. Value
About This Home
This home is located at 7869 Parsonage Ln, Colorado Springs, CO 80951 and is currently estimated at $445,628, approximately $254 per square foot. 7869 Parsonage Ln is a home located in El Paso County with nearby schools including Evans International Elementary School, Coldwater Canyon Elementary, and Clover Avenue Elementary School.
Ownership History
Date
Name
Owned For
Owner Type
Purchase Details
Closed on
Jun 13, 2012
Sold by
Freay Henry R and Bayron Freay Ann E
Bought by
Brokar Eric S and Brokar Jessica A
Current Estimated Value
Home Financials for this Owner
Home Financials are based on the most recent Mortgage that was taken out on this home.
Original Mortgage
$223,606
Outstanding Balance
$155,185
Interest Rate
3.86%
Mortgage Type
VA
Estimated Equity
$290,443
Purchase Details
Closed on
Mar 21, 2008
Sold by
Turner Monty R
Bought by
Freay Henry R and Bayron Freay Ann E
Home Financials for this Owner
Home Financials are based on the most recent Mortgage that was taken out on this home.
Original Mortgage
$208,386
Interest Rate
6.46%
Mortgage Type
VA
Purchase Details
Closed on
Dec 29, 2006
Sold by
Richmond American Homes Of Colorado Inc
Bought by
Turner Monty R
Home Financials for this Owner
Home Financials are based on the most recent Mortgage that was taken out on this home.
Original Mortgage
$188,563
Interest Rate
6.15%
Mortgage Type
Unknown
Create a Home Valuation Report for This Property
The Home Valuation Report is an in-depth analysis detailing your home's value as well as a comparison with similar homes in the area
Home Values in the Area
Average Home Value in this Area
Purchase History
| Date | Buyer | Sale Price | Title Company |
|---|---|---|---|
| Brokar Eric S | $218,900 | Enterprise Title Lllp | |
| Freay Henry R | $204,000 | Landamerica | |
| Turner Monty R | $235,800 | Stewart Title |
Source: Public Records
Mortgage History
| Date | Status | Borrower | Loan Amount |
|---|---|---|---|
| Open | Brokar Eric S | $223,606 | |
| Previous Owner | Freay Henry R | $208,386 | |
| Previous Owner | Turner Monty R | $188,563 |
Source: Public Records
Tax History Compared to Growth
Tax History
| Year | Tax Paid | Tax Assessment Tax Assessment Total Assessment is a certain percentage of the fair market value that is determined by local assessors to be the total taxable value of land and additions on the property. | Land | Improvement |
|---|---|---|---|---|
| 2025 | $2,032 | $30,520 | -- | -- |
| 2024 | $1,928 | $30,930 | $5,290 | $25,640 |
| 2023 | $1,928 | $30,930 | $5,290 | $25,640 |
| 2022 | $2,125 | $22,130 | $4,170 | $17,960 |
| 2021 | $2,205 | $22,770 | $4,290 | $18,480 |
| 2020 | $1,913 | $19,700 | $3,580 | $16,120 |
| 2019 | $2,009 | $19,700 | $3,580 | $16,120 |
| 2018 | $1,685 | $16,330 | $3,560 | $12,770 |
| 2017 | $1,587 | $16,330 | $3,560 | $12,770 |
| 2016 | $1,552 | $16,350 | $3,580 | $12,770 |
| 2015 | $1,553 | $16,350 | $3,580 | $12,770 |
| 2014 | $1,514 | $15,740 | $3,580 | $12,160 |
Source: Public Records
Map
Nearby Homes
- 7820 Parsonage Ln
- 1925 Dewhirst Dr
- 8163 Postrock Dr
- 1768 Reilly Grove
- 1874 Sandtoft Heights
- 1729 Sandtoft Heights
- 2034 Lillian Way
- 1998 Lattern Ct
- 1974 Capital Dr
- 1725 Bucolo Ave
- 1985 Reed Grass Way
- 1898 Woodpark Dr
- 1822 Bulrush Way
- 7340 Grama Grass Ct
- 2215 Reed Grass Way
- 1095 Western 623-L Dr Unit 623-L
- 2524 Obsidian Forest View
- 2245 Reed Grass Way
- 2265 Sage Grouse Ln
- 2322 Springside Dr
- 7875 Parsonage Ln
- 7863 Parsonage Ln
- 7881 Parsonage Ln
- 7857 Parsonage Ln
- 8043 Parsonage Ln
- 8037 Parsonage Ln
- 8049 Parsonage Ln
- 8031 Parsonage Ln
- 7851 Parsonage Ln
- 7887 Parsonage Ln
- 8055 Parsonage Ln
- 7868 Parsonage Ln
- 8025 Parsonage Ln
- 7874 Parsonage Ln
- 8061 Parsonage Ln
- 7862 Parsonage Ln
- 7845 Parsonage Ln
- 7899 Parsonage Ln
- 7880 Parsonage Ln
- 7856 Parsonage Ln