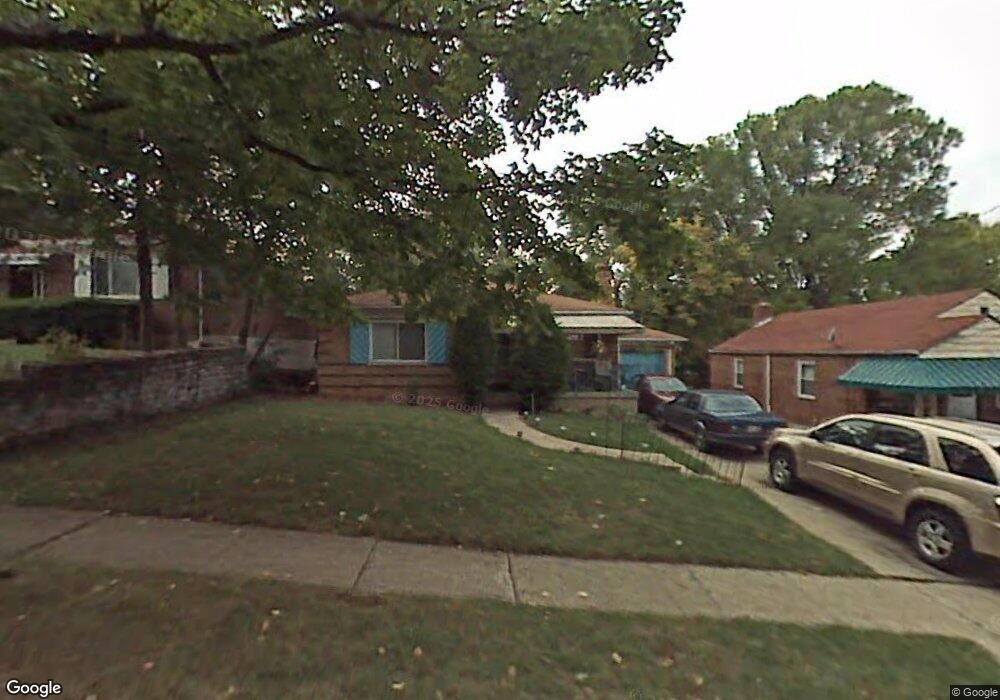
7869 Sunfield Dr Cincinnati, OH 45237
Roselawn NeighborhoodEstimated Value: $175,244 - $202,000
2
Beds
1
Bath
1,088
Sq Ft
$174/Sq Ft
Est. Value
About This Home
This home is located at 7869 Sunfield Dr, Cincinnati, OH 45237 and is currently estimated at $189,311, approximately $173 per square foot. 7869 Sunfield Dr is a home located in Hamilton County with nearby schools including Roselawn Condon School, Shroder High School, and Clark Montessori High School.
Ownership History
Date
Name
Owned For
Owner Type
Purchase Details
Closed on
Nov 24, 2009
Sold by
Cwd Project Development Inc
Bought by
Redding Michael
Current Estimated Value
Home Financials for this Owner
Home Financials are based on the most recent Mortgage that was taken out on this home.
Original Mortgage
$83,460
Outstanding Balance
$55,407
Interest Rate
5.25%
Mortgage Type
FHA
Estimated Equity
$133,904
Purchase Details
Closed on
Dec 28, 2007
Sold by
Young Ophelia L
Bought by
Bank Of New York Trust Co Na and Jpmorgan Chase Bank Na
Purchase Details
Closed on
Feb 28, 2002
Sold by
Reed Clara M and Reed Clara M
Bought by
Young Ophelia L
Home Financials for this Owner
Home Financials are based on the most recent Mortgage that was taken out on this home.
Original Mortgage
$83,200
Interest Rate
10.5%
Create a Home Valuation Report for This Property
The Home Valuation Report is an in-depth analysis detailing your home's value as well as a comparison with similar homes in the area
Home Values in the Area
Average Home Value in this Area
Purchase History
| Date | Buyer | Sale Price | Title Company |
|---|---|---|---|
| Redding Michael | $85,000 | Stewart Title Company | |
| Bank Of New York Trust Co Na | -- | Attorney | |
| Young Ophelia L | $83,200 | First Service Title Agency I |
Source: Public Records
Mortgage History
| Date | Status | Borrower | Loan Amount |
|---|---|---|---|
| Open | Redding Michael | $83,460 | |
| Previous Owner | Young Ophelia L | $83,200 |
Source: Public Records
Tax History Compared to Growth
Tax History
| Year | Tax Paid | Tax Assessment Tax Assessment Total Assessment is a certain percentage of the fair market value that is determined by local assessors to be the total taxable value of land and additions on the property. | Land | Improvement |
|---|---|---|---|---|
| 2024 | $2,124 | $35,389 | $6,094 | $29,295 |
| 2023 | $2,172 | $35,389 | $6,094 | $29,295 |
| 2022 | $1,516 | $22,093 | $4,064 | $18,029 |
| 2021 | $1,456 | $22,093 | $4,064 | $18,029 |
| 2020 | $1,487 | $22,093 | $4,064 | $18,029 |
| 2019 | $1,637 | $22,093 | $4,064 | $18,029 |
| 2018 | $1,639 | $22,093 | $4,064 | $18,029 |
| 2017 | $1,557 | $22,093 | $4,064 | $18,029 |
| 2016 | $2,123 | $29,750 | $5,313 | $24,437 |
| 2015 | $1,914 | $29,750 | $5,313 | $24,437 |
| 2014 | $1,928 | $29,750 | $5,313 | $24,437 |
| 2013 | $1,961 | $29,750 | $5,313 | $24,437 |
Source: Public Records
Map
Nearby Homes
- 7792 Stillwell Rd
- 7755 Newbedford Ave
- 1604 Crest Hill Ave
- 7871 Glenorchard Dr
- 7866 Greenland Place
- 7901 Glenorchard Dr
- 1627 Summit Rd
- 1623 Summit Rd
- 1614 Miramar Ct
- 1519 Section Rd
- 645 Blanche Ave
- 20 Clark Rd
- 8410 Curzon Ave
- 1373 Section Rd
- 8442 Anthony Wayne Ave
- 7247 Reading Rd
- 6770 Elbrook Ave
- 2281 E Galbraith Rd
- 230 Carthage Ave
- 1551 Kenova Ave
- 7885 Sunfield Dr
- 7861 Sunfield Dr
- 7891 Sunfield Dr
- 7853 Sunfield Dr
- 7874 Stillwell Rd
- 1800 Colmar Ln
- 7858 Stillwell Rd
- 7899 Sunfield Dr
- 7882 Stillwell Rd
- 1801 Wynnewood Ln
- 7845 Sunfield Dr
- 7850 Stillwell Rd
- 7890 Stillwell Rd
- 1804 Colmar Ln
- 7905 Sunfield Dr
- 1805 Wynnewood Ln
- 7842 Stillwell Rd
- 7837 Sunfield Dr
- 1801 Colmar Ln
- 1808 Colmar Ln