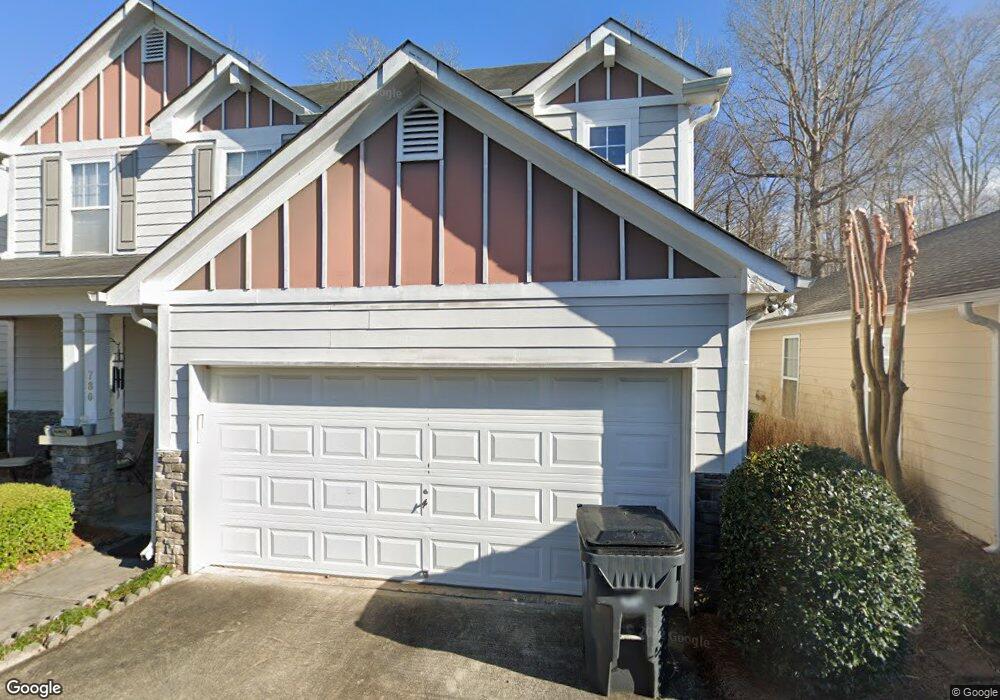
787 Cedar Loop Fairburn, GA 30213
Estimated Value: $236,000 - $343,000
4
Beds
3
Baths
1,710
Sq Ft
$169/Sq Ft
Est. Value
About This Home
This home is located at 787 Cedar Loop, Fairburn, GA 30213 and is currently estimated at $288,966, approximately $168 per square foot. 787 Cedar Loop is a home located in Fulton County with nearby schools including Renaissance Elementary School, Renaissance Middle School, and Langston Hughes High School.
Ownership History
Date
Name
Owned For
Owner Type
Purchase Details
Closed on
Jan 14, 2010
Sold by
Hud & Housing Of Urban Dev
Bought by
Hill Tashara
Current Estimated Value
Home Financials for this Owner
Home Financials are based on the most recent Mortgage that was taken out on this home.
Original Mortgage
$106,634
Outstanding Balance
$71,939
Interest Rate
5.5%
Mortgage Type
FHA
Estimated Equity
$217,027
Purchase Details
Closed on
Apr 1, 2008
Sold by
Everhome Mortgage
Bought by
Hud & Housing Of Urban Dev
Purchase Details
Closed on
Oct 17, 2003
Sold by
Cedar Grove Lakes Llc
Bought by
Bowen Family Homes Inc
Home Financials for this Owner
Home Financials are based on the most recent Mortgage that was taken out on this home.
Original Mortgage
$144,855
Interest Rate
6.03%
Mortgage Type
VA
Purchase Details
Closed on
Sep 30, 2003
Sold by
Beazer Homes Corp
Bought by
Owens Julie
Home Financials for this Owner
Home Financials are based on the most recent Mortgage that was taken out on this home.
Original Mortgage
$144,855
Interest Rate
6.03%
Mortgage Type
VA
Create a Home Valuation Report for This Property
The Home Valuation Report is an in-depth analysis detailing your home's value as well as a comparison with similar homes in the area
Home Values in the Area
Average Home Value in this Area
Purchase History
| Date | Buyer | Sale Price | Title Company |
|---|---|---|---|
| Hill Tashara | -- | -- | |
| Hud & Housing Of Urban Dev | -- | -- | |
| Everhome Mortgage Co | $147,053 | -- | |
| Bowen Family Homes Inc | $458,000 | -- | |
| Owens Julie | $146,000 | -- |
Source: Public Records
Mortgage History
| Date | Status | Borrower | Loan Amount |
|---|---|---|---|
| Open | Hill Tashara | $106,634 | |
| Previous Owner | Owens Julie | $144,855 |
Source: Public Records
Tax History
| Year | Tax Paid | Tax Assessment Tax Assessment Total Assessment is a certain percentage of the fair market value that is determined by local assessors to be the total taxable value of land and additions on the property. | Land | Improvement |
|---|---|---|---|---|
| 2025 | $962 | $108,920 | $22,600 | $86,320 |
| 2023 | $3,079 | $109,080 | $25,840 | $83,240 |
| 2022 | $877 | $89,000 | $16,040 | $72,960 |
| 2021 | $850 | $71,080 | $14,560 | $56,520 |
| 2020 | $847 | $65,520 | $13,400 | $52,120 |
| 2019 | $1,106 | $58,680 | $11,080 | $47,600 |
| 2018 | $1,378 | $53,360 | $10,800 | $42,560 |
| 2017 | $643 | $32,840 | $6,440 | $26,400 |
| 2016 | $641 | $32,840 | $6,440 | $26,400 |
| 2015 | $643 | $32,840 | $6,440 | $26,400 |
| 2014 | $651 | $32,840 | $6,440 | $26,400 |
Source: Public Records
Map
Nearby Homes
- 806 Hartstone Ct
- 6127 Landers Loop
- 6066 Allpoint Way Unit 3
- 7613 Cedar Grove Ct
- 7576 Jennadee Dr
- 7583 Waverly Loop
- 0 Short Rd Unit 7501417
- 6398 Foggy Oak Dr
- 6275 Short Rd
- 6235 Short Rd
- 8260 Equinox Ln
- 7980 Cedar Grove Rd
- 7327 Parks Trail
- 5896 Village Loop
- 7349 Parkland Bend
- 5745 Village Loop
- 8050 Dickens Dr
- 6725 Homer Ln
- 6713 Homer Ln
- 8051 Dickens Dr
- 777 Jasperson Ct
- 791 Cedar Loop
- 781 Jasperson Ct Unit 49
- 778 Jasperson Ct
- 785 Jasperson Ct
- 783 Cedar Loop
- 786 Jasperson Ct
- 782 Jasperson Ct Unit 46
- 789 Jasperson Ct
- 790 Jasperson Ct
- 784 Cedar Loop
- 779 Cedar Loop
- 7840 The Lakes Point
- 7852 The Lakes Point
- 7834 The Lakes Point
- 7858 The Lakes Point Unit 4
- 7858 The Lakes Point Unit 52
- 7828 The Lakes Point
- 780 Cedar Loop
- 780 Cedar Loop
Your Personal Tour Guide
Ask me questions while you tour the home.