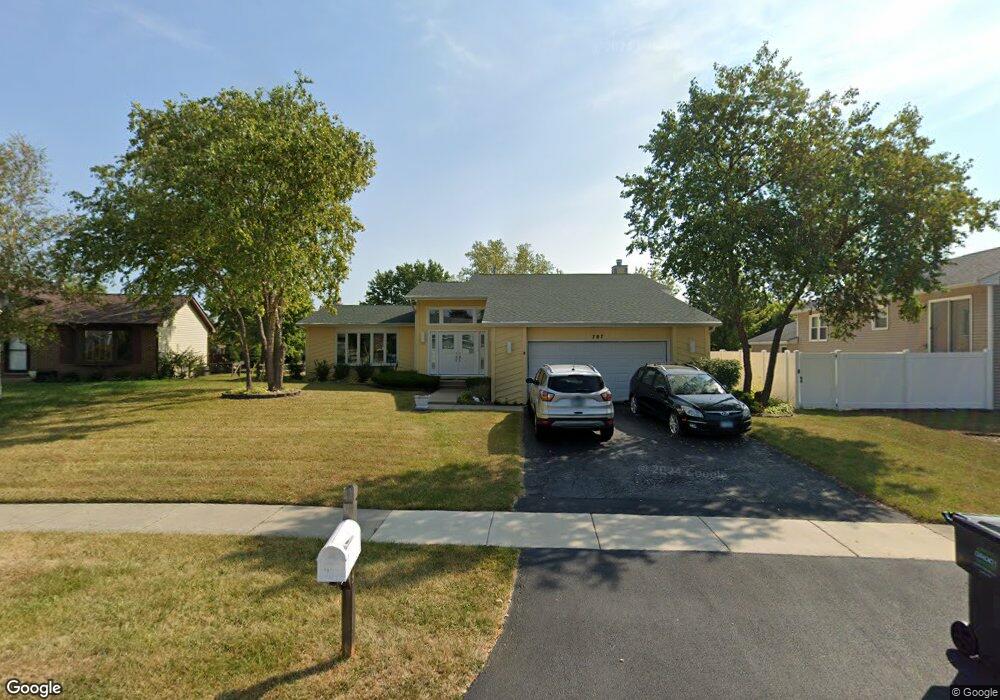
787 Colony Ave Unit 1 Lindenhurst, IL 60046
Estimated Value: $357,000 - $420,165
3
Beds
3
Baths
1,884
Sq Ft
$210/Sq Ft
Est. Value
About This Home
This home is located at 787 Colony Ave Unit 1, Lindenhurst, IL 60046 and is currently estimated at $395,291, approximately $209 per square foot. 787 Colony Ave Unit 1 is a home located in Lake County with nearby schools including Millburn Elementary School, Millburn Middle School, and Lakes Community High School.
Ownership History
Date
Name
Owned For
Owner Type
Purchase Details
Closed on
Aug 5, 2013
Sold by
Mason Yvonne M and German Ervin L
Bought by
Mason Yvonne M
Current Estimated Value
Purchase Details
Closed on
Jul 5, 2007
Sold by
Cardwell Rodney
Bought by
Mason Yvonne M
Home Financials for this Owner
Home Financials are based on the most recent Mortgage that was taken out on this home.
Original Mortgage
$280,000
Interest Rate
6.66%
Mortgage Type
Purchase Money Mortgage
Purchase Details
Closed on
Oct 20, 1995
Sold by
Grabowski Kevin M and Gonzalez Catherine M
Bought by
Cardwell Rodney T and Mason Yvonne M
Home Financials for this Owner
Home Financials are based on the most recent Mortgage that was taken out on this home.
Original Mortgage
$193,800
Interest Rate
7.7%
Create a Home Valuation Report for This Property
The Home Valuation Report is an in-depth analysis detailing your home's value as well as a comparison with similar homes in the area
Home Values in the Area
Average Home Value in this Area
Purchase History
| Date | Buyer | Sale Price | Title Company |
|---|---|---|---|
| Mason Yvonne M | -- | None Available | |
| Mason Yvonne M | -- | Ticor | |
| Mason Yvonne M | -- | None Available | |
| Cardwell Rodney T | $204,000 | -- |
Source: Public Records
Mortgage History
| Date | Status | Borrower | Loan Amount |
|---|---|---|---|
| Previous Owner | Mason Yvonne M | $280,000 | |
| Previous Owner | Cardwell Rodney T | $193,800 |
Source: Public Records
Tax History Compared to Growth
Tax History
| Year | Tax Paid | Tax Assessment Tax Assessment Total Assessment is a certain percentage of the fair market value that is determined by local assessors to be the total taxable value of land and additions on the property. | Land | Improvement |
|---|---|---|---|---|
| 2024 | $11,104 | $121,254 | $13,685 | $107,569 |
| 2023 | $12,354 | $107,133 | $12,091 | $95,042 |
| 2022 | $12,354 | $97,890 | $9,193 | $88,697 |
| 2021 | $11,904 | $90,563 | $8,540 | $82,023 |
| 2020 | $12,180 | $92,635 | $8,735 | $83,900 |
| 2019 | $12,215 | $89,029 | $8,395 | $80,634 |
| 2018 | $11,525 | $89,791 | $14,341 | $75,450 |
| 2017 | $11,184 | $87,397 | $13,959 | $73,438 |
| 2016 | $11,124 | $83,858 | $13,394 | $70,464 |
| 2015 | $10,612 | $78,321 | $12,510 | $65,811 |
| 2014 | $11,453 | $77,110 | $12,568 | $64,542 |
| 2012 | $10,254 | $90,840 | $14,143 | $76,697 |
Source: Public Records
Map
Nearby Homes
- 692 Monroe Dr
- 694 Monroe Dr
- 2726 Providence Ln
- 590 Oxford Ln
- 586 Harvard Ct
- 691 N Autumn Cir
- 527 Northgate Rd Unit 28
- 1896 E Vista Terrace
- 1847 Natures Ct
- 1820 Prairie Ridge Cir
- 19135 W Millburn Rd
- 812 Auburn Ln
- 422 Northgate Rd
- 20215 W Miller Rd
- 807 Wedgewood Ct
- 1650 Natures Way
- 725 Porter Cir
- 705 Porter Cir
- 724 Porter Cir
- 59 Chestnut Cir
- 2561 Hamilton Dr
- 2630 Constitution Dr
- 801 Colony Ave
- 2634 Constitution Dr
- 2531 Hamilton Dr
- 2542 Colony Ave
- 2541 Colony Ave
- 2640 Constitution Dr
- 2614 Hamilton Dr
- 819 Colony Ct
- 2521 Hamilton Dr
- 2528 Hamilton Dr
- 829 Colony Ct Unit 1
- 2630 Hamilton Dr
- 2531 Colony Ave
- 2644 Constitution Dr
- 752 Colony Ave
- 2511 Hamilton Dr
- 2631 Constitution Dr