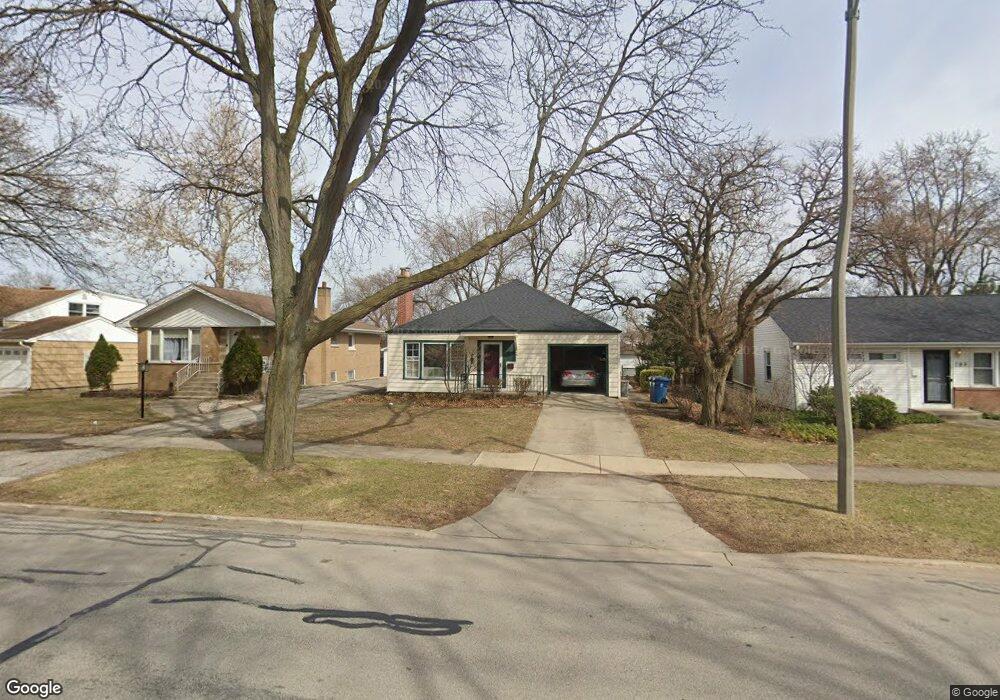
787 S Spring Rd Elmhurst, IL 60126
Estimated Value: $378,000 - $512,000
Studio
--
Bath
1,157
Sq Ft
$387/Sq Ft
Est. Value
About This Home
This home is located at 787 S Spring Rd, Elmhurst, IL 60126 and is currently estimated at $448,240, approximately $387 per square foot. 787 S Spring Rd is a home located in DuPage County with nearby schools including Jackson Elementary School, Bryan Middle School, and York Community High School.
Ownership History
Date
Name
Owned For
Owner Type
Purchase Details
Closed on
Aug 31, 1999
Sold by
Belmonte Maria
Bought by
Hinrichs Hill
Current Estimated Value
Purchase Details
Closed on
May 27, 1997
Sold by
Rautenberg Thomas
Bought by
Belmonte Maria
Home Financials for this Owner
Home Financials are based on the most recent Mortgage that was taken out on this home.
Original Mortgage
$102,400
Interest Rate
6.75%
Purchase Details
Closed on
Apr 18, 1997
Sold by
Rautenberg Thomas M
Bought by
Rautenberg Thomas M and Belmonte Maria
Home Financials for this Owner
Home Financials are based on the most recent Mortgage that was taken out on this home.
Original Mortgage
$102,400
Interest Rate
6.75%
Create a Home Valuation Report for This Property
The Home Valuation Report is an in-depth analysis detailing your home's value as well as a comparison with similar homes in the area
Home Values in the Area
Average Home Value in this Area
Purchase History
| Date | Buyer | Sale Price | Title Company |
|---|---|---|---|
| Hinrichs Hill | $155,000 | -- | |
| Belmonte Maria | $128,000 | -- | |
| Rautenberg Thomas M | -- | -- |
Source: Public Records
Mortgage History
| Date | Status | Borrower | Loan Amount |
|---|---|---|---|
| Previous Owner | Belmonte Maria | $102,400 |
Source: Public Records
Tax History
| Year | Tax Paid | Tax Assessment Tax Assessment Total Assessment is a certain percentage of the fair market value that is determined by local assessors to be the total taxable value of land and additions on the property. | Land | Improvement |
|---|---|---|---|---|
| 2024 | $6,626 | $125,951 | $67,101 | $58,850 |
| 2023 | $6,099 | $116,470 | $62,050 | $54,420 |
| 2022 | $6,123 | $111,970 | $59,660 | $52,310 |
| 2021 | $4,919 | $109,190 | $58,180 | $51,010 |
| 2020 | $4,839 | $106,790 | $56,900 | $49,890 |
| 2019 | $4,992 | $101,530 | $54,100 | $47,430 |
| 2018 | $5,021 | $96,590 | $51,200 | $45,390 |
| 2017 | $5,163 | $92,040 | $48,790 | $43,250 |
| 2016 | $5,025 | $86,700 | $45,960 | $40,740 |
| 2015 | $4,938 | $80,770 | $42,820 | $37,950 |
| 2014 | $6,190 | $91,320 | $39,090 | $52,230 |
| 2013 | $6,130 | $92,610 | $39,640 | $52,970 |
Source: Public Records
Map
Nearby Homes
- 868 S Spring Rd
- 742 S Saylor Ave
- 849 S Swain Ave
- 769 S Prospect Ave
- 696 S Prospect Ave
- 769 S Fairview Ave
- 878 S Parkside Ave
- 722 S Berkley Ave
- 936 S Mitchell Ave
- 663 S Hawthorne Ave
- 680 S Bryan St
- 881 S Bryan St
- 611 S Prospect Ave
- 857 S Euclid Ave
- 594 S Fairfield Ave
- 570 S Parkside Ave
- 593 S Sunnyside Ave
- 602 S Sunnyside Ave
- 906 S Kirk Ave
- 606 S York St
- 791 S Spring Rd
- 781 S Spring Rd
- 790 S Saylor Ave
- 794 S Saylor Ave
- 784 S Spring Rd
- 788 S Spring Rd
- 786 S Saylor Ave
- 780 S Spring Rd
- 776 S Spring Rd
- 782 S Saylor Ave
- 792 S Spring Rd
- 798 S Saylor Ave
- 291 W Madison St
- 796 S Spring Rd
- 804 S Saylor Ave
- 800 S Spring Rd
- 809 S Spring Rd
- 281 W Madison St
- 765 S Spring Rd
- 770 S Spring Rd
Your Personal Tour Guide
Ask me questions while you tour the home.