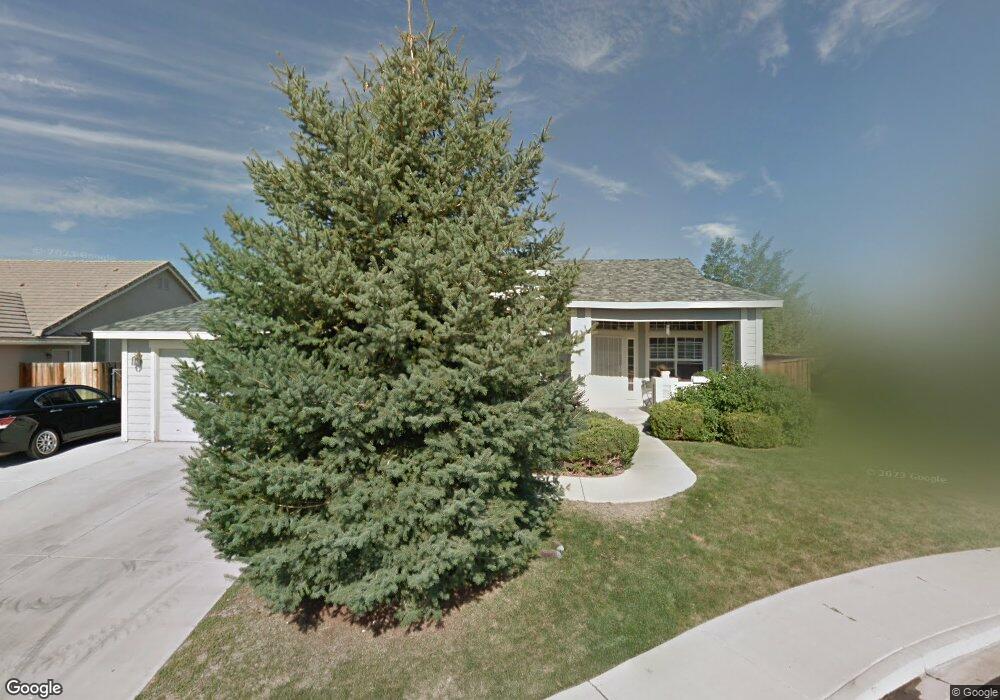
7871 Orbigo Ct Sparks, NV 89436
Wingfield Springs NeighborhoodEstimated Value: $499,083 - $518,000
3
Beds
2
Baths
1,406
Sq Ft
$361/Sq Ft
Est. Value
About This Home
This home is located at 7871 Orbigo Ct, Sparks, NV 89436 and is currently estimated at $507,271, approximately $360 per square foot. 7871 Orbigo Ct is a home located in Washoe County with nearby schools including Van Gorder Elementary School, Sky Ranch Middle School, and Spanish Springs High School.
Ownership History
Date
Name
Owned For
Owner Type
Purchase Details
Closed on
Dec 10, 2003
Sold by
Hack Linda C
Bought by
Seeley Lenora Ann
Current Estimated Value
Home Financials for this Owner
Home Financials are based on the most recent Mortgage that was taken out on this home.
Original Mortgage
$148,500
Interest Rate
5.85%
Mortgage Type
Unknown
Purchase Details
Closed on
Dec 5, 2002
Sold by
Hack Linda C
Bought by
Hack Linda C and Seeley Lenora Ann
Purchase Details
Closed on
Sep 18, 2000
Sold by
Jakubik Wayne W and Jakubik Sandra L
Bought by
Hack Linda C
Home Financials for this Owner
Home Financials are based on the most recent Mortgage that was taken out on this home.
Original Mortgage
$65,000
Interest Rate
7.98%
Purchase Details
Closed on
Nov 13, 1997
Sold by
Bighorn Development Iii Ltd
Bought by
Jakubik Wayne W and Jakubik Sandra L
Home Financials for this Owner
Home Financials are based on the most recent Mortgage that was taken out on this home.
Original Mortgage
$142,650
Interest Rate
7.3%
Mortgage Type
VA
Create a Home Valuation Report for This Property
The Home Valuation Report is an in-depth analysis detailing your home's value as well as a comparison with similar homes in the area
Home Values in the Area
Average Home Value in this Area
Purchase History
| Date | Buyer | Sale Price | Title Company |
|---|---|---|---|
| Seeley Lenora Ann | -- | -- | |
| Hack Linda C | -- | -- | |
| Hack Linda C | $149,500 | Stewart Title Northern Nevad | |
| Jakubik Wayne W | $140,000 | Western Title Company Inc |
Source: Public Records
Mortgage History
| Date | Status | Borrower | Loan Amount |
|---|---|---|---|
| Previous Owner | Seeley Lenora Ann | $148,500 | |
| Previous Owner | Hack Linda C | $65,000 | |
| Previous Owner | Jakubik Wayne W | $142,650 |
Source: Public Records
Tax History Compared to Growth
Tax History
| Year | Tax Paid | Tax Assessment Tax Assessment Total Assessment is a certain percentage of the fair market value that is determined by local assessors to be the total taxable value of land and additions on the property. | Land | Improvement |
|---|---|---|---|---|
| 2025 | $2,335 | $98,568 | $36,855 | $61,713 |
| 2024 | $2,335 | $94,701 | $32,200 | $62,501 |
| 2023 | $2,268 | $95,738 | $36,750 | $58,988 |
| 2022 | $2,206 | $77,615 | $28,490 | $49,125 |
| 2021 | $2,552 | $71,911 | $22,995 | $48,916 |
| 2020 | $2,530 | $72,726 | $23,625 | $49,101 |
| 2019 | $2,552 | $69,674 | $21,875 | $47,799 |
| 2018 | $1,955 | $62,535 | $15,785 | $46,750 |
| 2017 | $3,799 | $62,295 | $15,365 | $46,930 |
| 2016 | $1,850 | $61,764 | $13,685 | $48,079 |
| 2015 | $1,744 | $58,692 | $13,405 | $45,287 |
| 2014 | $1,695 | $54,381 | $10,430 | $43,951 |
| 2013 | -- | $42,467 | $8,155 | $34,312 |
Source: Public Records
Map
Nearby Homes
- 7859 Guerra Ct
- 7850 Morro Ave
- 7827 Morro Ave
- 3110 Rama Ct
- 3131 Manzana Ct
- 7980 Teruel Ct
- 7861 Cantabria Dr
- 8080 Tres Arroyos Ct
- 7948 Hat Creek Dr
- 2750 Arrow Smith Dr
- 7685 Avila Ct
- 3123 Minino Ct
- 3461 Tavira Ct
- 7476 Lorna Ln
- 2608 Arrow Smith Dr Unit 13B
- 7368 S Florentine Dr
- 7366 Grand Island Dr
- 7420 Island Queen Dr
- 7718 Rhythm Cir
- 7523 Hoback Dr
- 7861 Orbigo Ct
- 7881 Orbigo Ct
- 7882 Guerra Ct Unit 3
- 7874 Guerra Ct
- 7890 Guerra Ct Unit 3
- 7855 Orbigo Ct
- 7891 Orbigo Ct Unit 3
- 7866 Guerra Ct
- 7860 Orbigo Ct
- 7870 Orbigo Ct
- 7858 Guerra Ct
- 7890 Orbigo Ct Unit 3
- 7898 Guerra Ct
- 7851 Orbigo Ct
- 7880 Orbigo Ct Unit 3
- 7852 Guerra Ct Unit 3
- 7875 Guerra Ct
- 7883 Guerra Ct
- 3215 Brisa Ct
- 7897 Guerra Ct