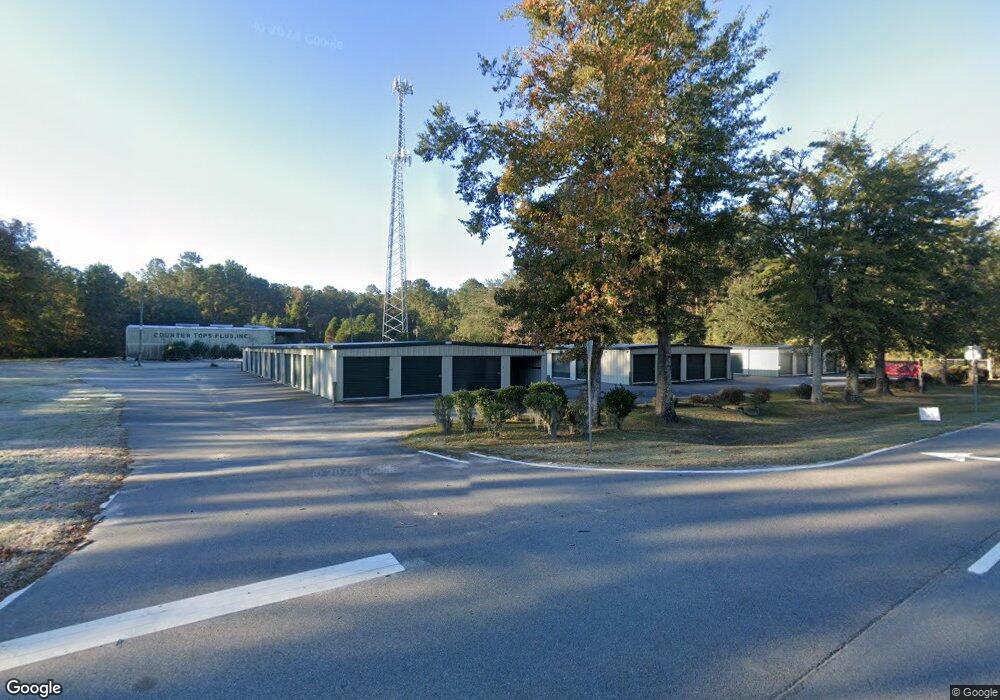
7873 E Oglethorpe Hwy Midway, GA 31320
Estimated Value: $994,180
Studio
--
Bath
14,800
Sq Ft
$67/Sq Ft
Est. Value
About This Home
This home is located at 7873 E Oglethorpe Hwy, Midway, GA 31320 and is currently estimated at $994,180, approximately $67 per square foot. 7873 E Oglethorpe Hwy is a home located in Liberty County with nearby schools including Liberty Elementary School, Midway Middle School, and Liberty County High School.
Ownership History
Date
Name
Owned For
Owner Type
Purchase Details
Closed on
Feb 8, 2024
Sold by
Storage Spot Midway Llc
Bought by
Storage Spot Llc
Current Estimated Value
Home Financials for this Owner
Home Financials are based on the most recent Mortgage that was taken out on this home.
Original Mortgage
$625,000
Outstanding Balance
$603,235
Interest Rate
6.66%
Mortgage Type
New Conventional
Estimated Equity
$390,945
Purchase Details
Closed on
Jun 12, 2020
Sold by
Carter Linda K
Bought by
Storage Spot Midway Llc
Home Financials for this Owner
Home Financials are based on the most recent Mortgage that was taken out on this home.
Original Mortgage
$423,750
Interest Rate
3.2%
Mortgage Type
Commercial
Purchase Details
Closed on
Jul 14, 1998
Bought by
Carter Lamar and Carter Linda
Create a Home Valuation Report for This Property
The Home Valuation Report is an in-depth analysis detailing your home's value as well as a comparison with similar homes in the area
Purchase History
| Date | Buyer | Sale Price | Title Company |
|---|---|---|---|
| Storage Spot Llc | $1,000,000 | -- | |
| Storage Spot Midway Llc | $565,000 | -- | |
| Carter Lamar | $40,000 | -- |
Source: Public Records
Mortgage History
| Date | Status | Borrower | Loan Amount |
|---|---|---|---|
| Open | Storage Spot Llc | $625,000 | |
| Previous Owner | Storage Spot Midway Llc | $423,750 |
Source: Public Records
Tax History
| Year | Tax Paid | Tax Assessment Tax Assessment Total Assessment is a certain percentage of the fair market value that is determined by local assessors to be the total taxable value of land and additions on the property. | Land | Improvement |
|---|---|---|---|---|
| 2025 | $18,776 | $105,967 | $40,720 | $65,247 |
| 2024 | $4,710 | $111,520 | $40,720 | $70,800 |
| 2023 | $4,453 | $115,685 | $40,720 | $74,965 |
| 2022 | $3,952 | $102,662 | $40,720 | $61,942 |
| 2021 | $4,223 | $110,138 | $40,720 | $69,418 |
| 2020 | $4,364 | $113,342 | $40,720 | $72,622 |
| 2019 | $4,371 | $116,546 | $40,720 | $75,826 |
| 2018 | $4,634 | $125,090 | $27,417 | $97,673 |
| 2017 | $3,558 | $108,052 | $23,682 | $84,370 |
| 2016 | $3,665 | $125,090 | $40,720 | $84,370 |
| 2015 | $3,765 | $108,052 | $18,343 | $89,709 |
| 2014 | $3,765 | $108,052 | $18,343 | $89,709 |
| 2013 | -- | $130,429 | $40,720 | $89,709 |
Source: Public Records
Map
Nearby Homes
- 7337 E Oglethorpe Hwy
- 0000 Bill Carter Rd
- 8701 E Oglethorpe Hwy
- 48 W Beaver Ln
- 35 W Red Fox Ct
- 327 River Bend Dr
- 194 Julie Ln
- 146 River Bend Dr
- 153 Hughes Dr
- 46 Delaney Ct
- 29 Arlen Dr
- 260 Arlen Dr
- 0 E Oglethorpe Unit SA341930
- 0 E Oglethorpe Unit 153327
- 0 E Oglethorpe Unit 10592168
- 0 E Oglethorpe Unit SA350017
- 0 E Oglethorpe Unit SA350025
- 176 Dave Williams Rd
- 6228 E Oglethorpe Hwy
- 0000 E Oglethorpe Hwy
- 7921 E Oglethorpe Hwy
- 8041 E Oglethorpe Hwy
- 7729 E Oglethorpe Hwy
- 7713 E Oglethorpe Hwy
- 7742 E Oglethorpe Hwy
- 7704 E Oglethorpe Hwy
- 7701 E Oglethorpe Hwy
- 7673 E Oglethorpe Hwy
- 7655 E Oglethorpe Hwy
- 7650 E Oglethorpe Hwy
- 8158 E Oglethorpe Hwy
- 7826 E Oglethorpe Hwy
- 8171 E Oglethorpe Hwy
- 7583 E Oglethorpe Hwy
- 8192 E Oglethorpe Hwy
- 8216 E Oglethorpe Hwy
- 7578 E Oglethorpe Hwy
- 50 Alpha Dr
- 7550 E Oglethorpe Hwy
- 7518 E Oglethorpe Hwy
Your Personal Tour Guide
Ask me questions while you tour the home.