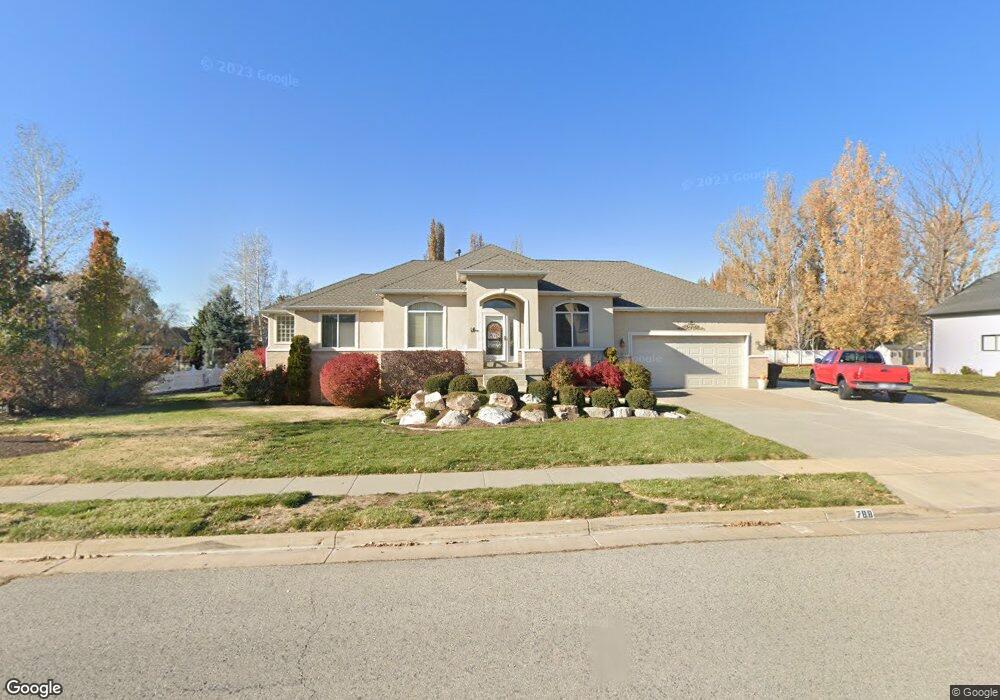
788 Chester Ln Kaysville, UT 84037
West Kaysville NeighborhoodEstimated Value: $695,000 - $834,000
4
Beds
2
Baths
3,612
Sq Ft
$213/Sq Ft
Est. Value
About This Home
This home is located at 788 Chester Ln, Kaysville, UT 84037 and is currently estimated at $771,013, approximately $213 per square foot. 788 Chester Ln is a home located in Davis County with nearby schools including Kaysville Elementary School, Farmington High, and Centennial Junior High School.
Ownership History
Date
Name
Owned For
Owner Type
Purchase Details
Closed on
Apr 13, 2010
Sold by
Bell John T and Bell Amber A
Bought by
Simkins Nanette S
Current Estimated Value
Purchase Details
Closed on
Nov 30, 2005
Sold by
Eames Ronnie W and Eames Kami W
Bought by
Bell John T and Bell Amber A
Home Financials for this Owner
Home Financials are based on the most recent Mortgage that was taken out on this home.
Original Mortgage
$182,000
Interest Rate
6.07%
Mortgage Type
Fannie Mae Freddie Mac
Purchase Details
Closed on
May 28, 1998
Sold by
S M Carter Company and Eames Ronnie W
Bought by
Eames Ronnie W and Eames Kami W
Home Financials for this Owner
Home Financials are based on the most recent Mortgage that was taken out on this home.
Original Mortgage
$204,000
Interest Rate
7.13%
Purchase Details
Closed on
Dec 11, 1997
Sold by
Princeton Development Llc
Bought by
S M Carter Company
Purchase Details
Closed on
Dec 10, 1997
Sold by
S M Carter Company
Bought by
S M Carter Company and Eames Ronnie W
Create a Home Valuation Report for This Property
The Home Valuation Report is an in-depth analysis detailing your home's value as well as a comparison with similar homes in the area
Home Values in the Area
Average Home Value in this Area
Purchase History
| Date | Buyer | Sale Price | Title Company |
|---|---|---|---|
| Simkins Nanette S | -- | Backman Title Services | |
| Simkins Nanette S | -- | Backman Title Services | |
| Bell John T | -- | Security Title Of Davis Coun | |
| Eames Ronnie W | -- | Security Title | |
| S M Carter Company | -- | Bonneville Title Company Inc | |
| S M Carter Company | -- | Bonneville Title Company Inc |
Source: Public Records
Mortgage History
| Date | Status | Borrower | Loan Amount |
|---|---|---|---|
| Previous Owner | Bell John T | $182,000 | |
| Previous Owner | Eames Ronnie W | $204,000 |
Source: Public Records
Tax History Compared to Growth
Tax History
| Year | Tax Paid | Tax Assessment Tax Assessment Total Assessment is a certain percentage of the fair market value that is determined by local assessors to be the total taxable value of land and additions on the property. | Land | Improvement |
|---|---|---|---|---|
| 2025 | $3,343 | $366,850 | $219,464 | $147,386 |
| 2024 | $3,343 | $352,549 | $207,456 | $145,093 |
| 2023 | $3,288 | $337,700 | $201,807 | $135,892 |
| 2022 | $3,328 | $634,000 | $364,078 | $269,922 |
| 2021 | $3,146 | $494,000 | $239,482 | $254,518 |
| 2020 | $2,845 | $435,000 | $204,947 | $230,053 |
| 2019 | $2,724 | $409,000 | $204,260 | $204,740 |
| 2018 | $2,532 | $379,000 | $173,117 | $205,883 |
| 2016 | $2,374 | $186,780 | $80,093 | $106,687 |
| 2015 | $2,391 | $178,640 | $80,093 | $98,547 |
| 2014 | $2,435 | $185,241 | $65,073 | $120,168 |
| 2013 | -- | $142,401 | $57,883 | $84,518 |
Source: Public Records
Map
Nearby Homes
- 1087 Barnes Dr
- 48 S Flint St
- 454 S Jay St W
- 203 S Larkin Ln
- 444 Creekside Way
- 52 S Grandison Ct E Unit 83-R
- 1346 W Blackbird Ln Unit 3
- 109 S Rock Loft Ridge Dr Unit 56-R
- 159 S Rock Loft Ridge Dr Unit 59-R
- 209 N Rock Loft Ridge E Unit 32-R
- 180 S Rock Loft Ridge Dr E Unit 7-R
- 246 N Rock Loft Ridge Dr Unit 36-R
- 22 S Rock Loft Ridge Dr Unit 16-R
- 34 S Rock Loft Ridge Dr Unit 85-R
- 190 N Rock Loft Ridge Dr Unit 40-R
- 75 S Grandison Ct E Unit 69-R
- 93 S Rock Loft Ridge Dr Unit 55-R
- 167 S Grandison E Unit 74-R
- 127 S Rock Loft Ridge Dr Unit 57-R
- 28 N Rock Loft Ridge Dr Unit 46-R