788 Delmar Ct Unit 3 University Park, IL 60484
Estimated Value: $79,368 - $117,000
3
Beds
2
Baths
1,148
Sq Ft
$81/Sq Ft
Est. Value
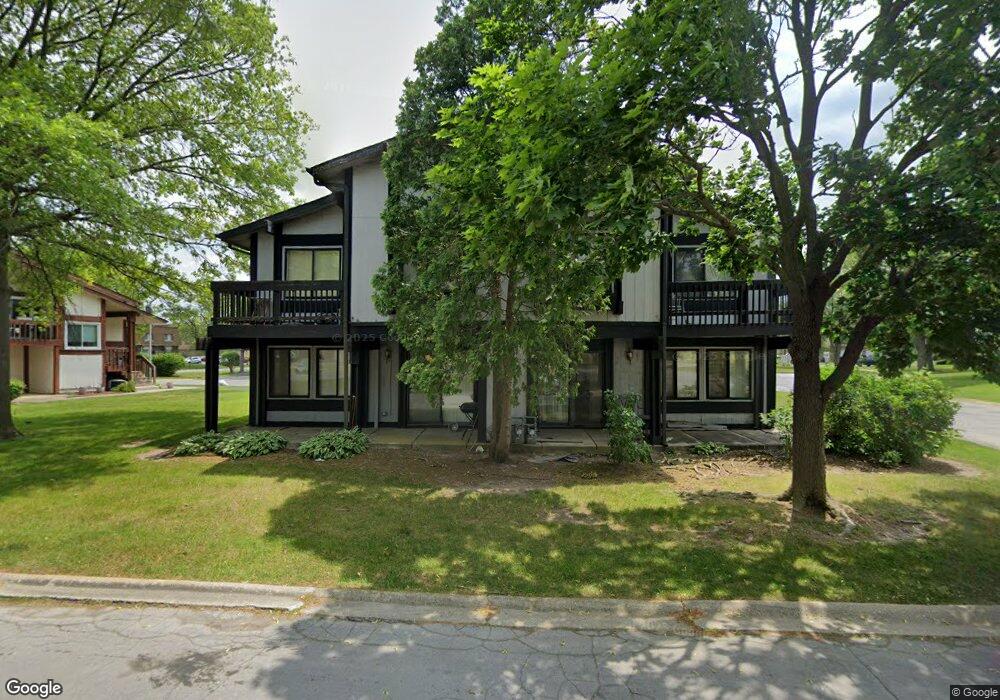
About This Home
This home is located at 788 Delmar Ct Unit 3, University Park, IL 60484 and is currently estimated at $93,092, approximately $81 per square foot. 788 Delmar Ct Unit 3 is a home located in Will County with nearby schools including Monee Elementary School, Crete-Monee Middle School, and Crete-Monee High School.
Ownership History
Date
Name
Owned For
Owner Type
Purchase Details
Closed on
Apr 9, 2009
Sold by
Us Bank National Association
Bought by
Stithos Dionisios
Current Estimated Value
Purchase Details
Closed on
Apr 24, 2008
Sold by
Harris Charles
Bought by
Us Bank Na
Purchase Details
Closed on
Oct 4, 2005
Sold by
Jackson Denise
Bought by
Harris Charles
Home Financials for this Owner
Home Financials are based on the most recent Mortgage that was taken out on this home.
Original Mortgage
$67,500
Interest Rate
9.35%
Mortgage Type
Purchase Money Mortgage
Purchase Details
Closed on
Aug 30, 1999
Sold by
Knight Adrienne P and Frazier Adrienne P
Bought by
Jackson Denise
Home Financials for this Owner
Home Financials are based on the most recent Mortgage that was taken out on this home.
Original Mortgage
$48,000
Interest Rate
7.83%
Mortgage Type
Purchase Money Mortgage
Create a Home Valuation Report for This Property
The Home Valuation Report is an in-depth analysis detailing your home's value as well as a comparison with similar homes in the area
Home Values in the Area
Average Home Value in this Area
Purchase History
| Date | Buyer | Sale Price | Title Company |
|---|---|---|---|
| Stithos Dionisios | $20,500 | First American Title | |
| Us Bank Na | -- | None Available | |
| Harris Charles | $75,000 | Greater Illinois Title Compa | |
| Jackson Denise | $60,000 | -- |
Source: Public Records
Mortgage History
| Date | Status | Borrower | Loan Amount |
|---|---|---|---|
| Previous Owner | Harris Charles | $67,500 | |
| Previous Owner | Jackson Denise | $48,000 |
Source: Public Records
Tax History Compared to Growth
Tax History
| Year | Tax Paid | Tax Assessment Tax Assessment Total Assessment is a certain percentage of the fair market value that is determined by local assessors to be the total taxable value of land and additions on the property. | Land | Improvement |
|---|---|---|---|---|
| 2024 | $3,664 | $29,188 | $2,719 | $26,469 |
| 2023 | $3,664 | $25,162 | $2,344 | $22,818 |
| 2022 | $3,119 | $22,134 | $2,062 | $20,072 |
| 2021 | $2,971 | $20,146 | $1,894 | $18,252 |
| 2020 | $2,946 | $19,493 | $1,833 | $17,660 |
| 2019 | $2,998 | $18,485 | $1,738 | $16,747 |
| 2018 | $2,991 | $18,077 | $1,700 | $16,377 |
| 2017 | $3,049 | $18,027 | $1,659 | $16,368 |
| 2016 | $2,943 | $17,367 | $1,598 | $15,769 |
| 2015 | $2,664 | $16,245 | $1,404 | $14,841 |
| 2014 | $2,664 | $16,474 | $1,385 | $15,089 |
| 2013 | $2,664 | $17,250 | $1,450 | $15,800 |
Source: Public Records
Map
Nearby Homes
- 786 Delmar Ct Unit 6
- 768 Mendocino Ct Unit 5
- 766 Mendocino Ct
- 735 Sandpiper Ct Unit 1
- 820 Sandra Dr Unit 2C
- 912 Cordoba Ct
- 882 White Oak Ln Unit 3
- 662 Sullivan Ln
- 708 Blackhawk Dr
- 655 Sullivan Ln
- 724 Union Dr
- 610 Sandra Dr
- 608 Sullivan Ln
- 713 Circle Dr
- 807 Blackhawk Dr
- 815 Blackhawk Dr
- 735 Union Dr
- 903 Blackhawk Dr
- 607 Sullivan Ln
- 612 Hickok Ave
- 788 Delmar Ct Unit 2
- 788 Delmar Ct Unit 1
- 786 Delmar Ct Unit 5
- 786 Delmar Ct Unit 4
- 786 Delmar Ct
- 782 Delmar Ct Unit 3
- 782 Delmar Ct Unit 1
- 782 Delmar Ct Unit 2
- 784 Delmar Ct Unit 6
- 784 Delmar Ct Unit 5
- 784 Delmar Ct Unit 4
- 748 Manteca Ct Unit 5
- 748 Manteca Ct Unit 4
- 748 Manteca Ct Unit 6
- 748 Manteca Ct
- 746 Manteca Ct Unit 4
- 746 Manteca Ct Unit 6
- 746 Manteca Ct
- 746 Manteca Ct Unit 5
- 780 Sunset Ct