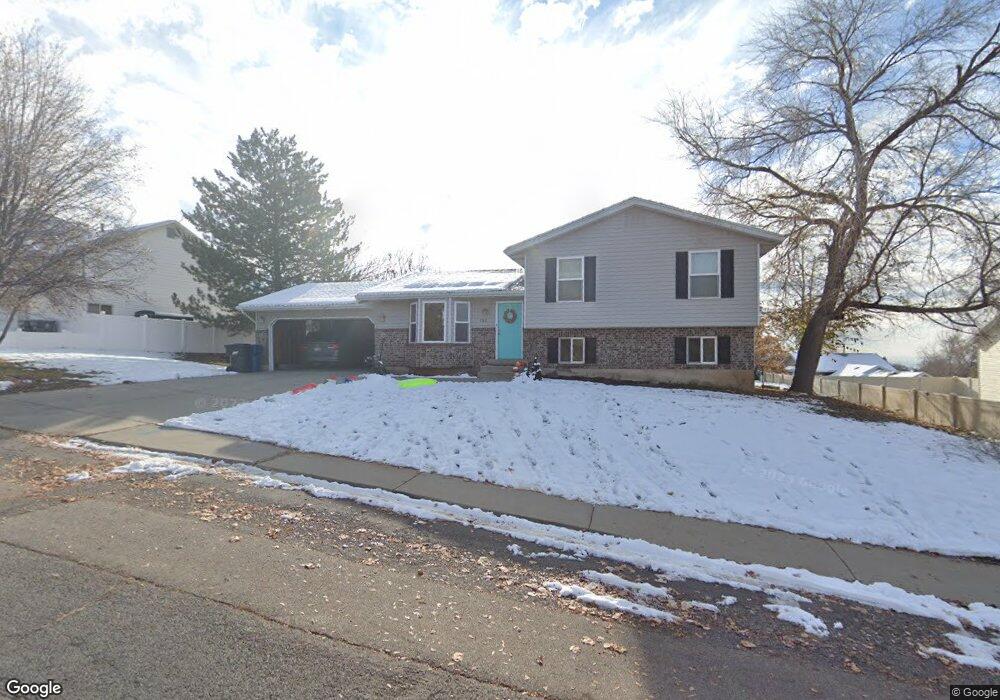
788 E 750 N Pleasant Grove, UT 84062
Estimated Value: $533,000 - $646,000
5
Beds
3
Baths
2,209
Sq Ft
$265/Sq Ft
Est. Value
About This Home
This home is located at 788 E 750 N, Pleasant Grove, UT 84062 and is currently estimated at $584,622, approximately $264 per square foot. 788 E 750 N is a home located in Utah County with nearby schools including Grovecrest Elementary School, Pleasant Grove Junior High School, and Pleasant Grove High School.
Ownership History
Date
Name
Owned For
Owner Type
Purchase Details
Closed on
Jan 30, 2017
Sold by
Yerman Jack L and Yerman Margo Jo
Bought by
Yerman Jack L
Current Estimated Value
Purchase Details
Closed on
May 12, 2016
Sold by
Kirby Robert C and Kirby Collen A
Bought by
Sanchez Felipe T and Carter Krystin J
Home Financials for this Owner
Home Financials are based on the most recent Mortgage that was taken out on this home.
Original Mortgage
$254,600
Outstanding Balance
$202,149
Interest Rate
3.58%
Mortgage Type
New Conventional
Estimated Equity
$382,473
Purchase Details
Closed on
Sep 4, 2015
Sold by
Lewis Kerry G and Lewis Elizabeth
Bought by
Skaggs Shayne D and Skaggs Kamryn
Home Financials for this Owner
Home Financials are based on the most recent Mortgage that was taken out on this home.
Original Mortgage
$337,908
Interest Rate
3.97%
Mortgage Type
Construction
Purchase Details
Closed on
Apr 27, 2000
Sold by
Clements Bradley H and Clements Geraldine I
Bought by
Kirby Robert C and Kirby Colleen A
Create a Home Valuation Report for This Property
The Home Valuation Report is an in-depth analysis detailing your home's value as well as a comparison with similar homes in the area
Home Values in the Area
Average Home Value in this Area
Purchase History
| Date | Buyer | Sale Price | Title Company |
|---|---|---|---|
| Yerman Jack L | -- | None Available | |
| Sanchez Felipe T | -- | First American Title Insuran | |
| Skaggs Shayne D | -- | Backman Title Services Ltd | |
| Kirby Robert C | -- | Pro Title & Escrow Inc |
Source: Public Records
Mortgage History
| Date | Status | Borrower | Loan Amount |
|---|---|---|---|
| Open | Sanchez Felipe T | $254,600 | |
| Previous Owner | Skaggs Shayne D | $337,908 |
Source: Public Records
Tax History Compared to Growth
Tax History
| Year | Tax Paid | Tax Assessment Tax Assessment Total Assessment is a certain percentage of the fair market value that is determined by local assessors to be the total taxable value of land and additions on the property. | Land | Improvement |
|---|---|---|---|---|
| 2025 | $2,302 | $293,205 | $232,000 | $301,100 |
| 2024 | $2,302 | $268,620 | $0 | $0 |
| 2023 | $2,187 | $267,245 | $0 | $0 |
| 2022 | $2,321 | $282,205 | $0 | $0 |
| 2021 | $2,100 | $388,700 | $166,500 | $222,200 |
| 2020 | $1,923 | $348,900 | $148,700 | $200,200 |
| 2019 | $1,709 | $320,700 | $141,300 | $179,400 |
| 2018 | $1,650 | $292,700 | $133,800 | $158,900 |
| 2017 | $1,550 | $146,465 | $0 | $0 |
| 2016 | $1,370 | $124,960 | $0 | $0 |
| 2015 | $1,381 | $119,240 | $0 | $0 |
| 2014 | $1,360 | $116,380 | $0 | $0 |
Source: Public Records
Map
Nearby Homes