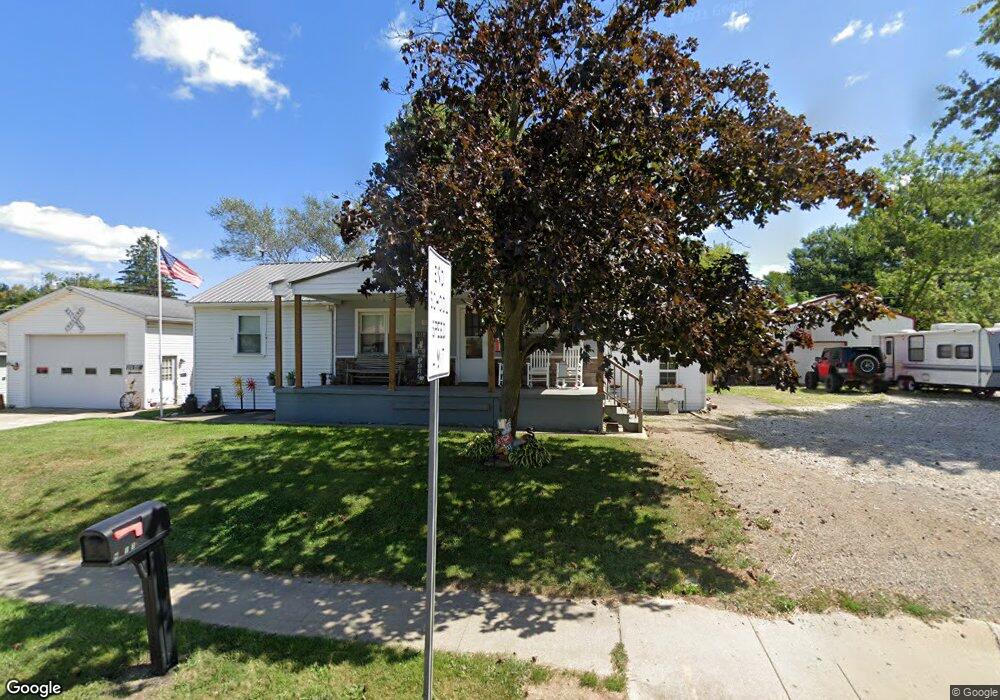
788 N Trimble Rd Mansfield, OH 44906
Estimated Value: $135,252 - $205,000
3
Beds
2
Baths
1,056
Sq Ft
$152/Sq Ft
Est. Value
About This Home
This home is located at 788 N Trimble Rd, Mansfield, OH 44906 and is currently estimated at $160,063, approximately $151 per square foot. 788 N Trimble Rd is a home located in Richland County with nearby schools including Foundation Academy, Mansfield Elective Academy, and Goal Digital Academy.
Ownership History
Date
Name
Owned For
Owner Type
Purchase Details
Closed on
Mar 31, 2016
Sold by
Lyons Matthew L and Lyons Kristina L
Bought by
Mcginty Edward J and Mcginty Sandy A
Current Estimated Value
Home Financials for this Owner
Home Financials are based on the most recent Mortgage that was taken out on this home.
Original Mortgage
$65,049
Outstanding Balance
$52,411
Interest Rate
4.12%
Mortgage Type
FHA
Estimated Equity
$107,652
Purchase Details
Closed on
Jun 30, 2010
Sold by
Eckstein Joann Wilson and Estate Of Homer Wilson
Bought by
Lyons Matthew L and Lyons Kristina L
Home Financials for this Owner
Home Financials are based on the most recent Mortgage that was taken out on this home.
Original Mortgage
$55,255
Interest Rate
5.75%
Mortgage Type
FHA
Purchase Details
Closed on
Mar 14, 2008
Sold by
Estate Of Lula Wilson
Bought by
Eckstein Joann Wilson and Homer Wilson Estate
Create a Home Valuation Report for This Property
The Home Valuation Report is an in-depth analysis detailing your home's value as well as a comparison with similar homes in the area
Home Values in the Area
Average Home Value in this Area
Purchase History
| Date | Buyer | Sale Price | Title Company |
|---|---|---|---|
| Mcginty Edward J | $66,250 | Southern Title | |
| Lyons Matthew L | $1,000 | Chicago Title | |
| Lyons Matthew L | $56,000 | Chicago Title | |
| Eckstein Joann Wilson | -- | None Available |
Source: Public Records
Mortgage History
| Date | Status | Borrower | Loan Amount |
|---|---|---|---|
| Open | Mcginty Edward J | $65,049 | |
| Previous Owner | Lyons Matthew L | $55,255 |
Source: Public Records
Tax History Compared to Growth
Tax History
| Year | Tax Paid | Tax Assessment Tax Assessment Total Assessment is a certain percentage of the fair market value that is determined by local assessors to be the total taxable value of land and additions on the property. | Land | Improvement |
|---|---|---|---|---|
| 2024 | $1,840 | $33,460 | $4,600 | $28,860 |
| 2023 | $1,840 | $33,460 | $4,600 | $28,860 |
| 2022 | $1,725 | $25,790 | $4,360 | $21,430 |
| 2021 | $1,735 | $25,790 | $4,360 | $21,430 |
| 2020 | $1,767 | $25,790 | $4,360 | $21,430 |
| 2019 | $1,710 | $22,230 | $3,700 | $18,530 |
| 2018 | $1,612 | $22,230 | $3,700 | $18,530 |
| 2017 | $1,535 | $22,230 | $3,700 | $18,530 |
| 2016 | $1,502 | $20,480 | $3,780 | $16,700 |
| 2015 | $1,407 | $20,480 | $3,780 | $16,700 |
| 2014 | $1,391 | $20,480 | $3,780 | $16,700 |
| 2012 | $592 | $21,560 | $3,980 | $17,580 |
Source: Public Records
Map
Nearby Homes
- 874 Fairfax Ave
- 876 Fairfax Ave
- 933 Fairfax Ave
- 741 Burger Ave
- 946 Belmont Ave
- 1169 Seminole Ave
- 1168 & 1171 Seminole Ave
- 641 Averill Ave
- 0 Herring Ave
- 1170 Fairfax Ave
- 340 Boston Ave
- 0 State Route 314 Unit 9069650
- 0 State Route 314 Unit 9067316
- 0 State Route 314 Unit 225021979
- 0 Stone Rd
- 1592 Walker Woods Blvd
- 0 Walker Lake Rd
- 0 W Fourth St - Trimble Lenox
- 0 Highway 30
- 1496 W 4th St
- 803 N Trimble Rd
- 789 N Trimble Rd
- 777 N Trimble Rd
- 772 N Trimble Rd
- 772 N Trimble Rd
- 783 Lenox Ave
- 777 Lenox Ave
- 787 Lenox Ave
- 764 N Trimble Rd
- 807 N Trimble Rd
- 813 N Trimble Rd
- 760 N Trimble Rd
- 767 Lenox Ave
- 816 N Trimble Rd
- 817 Lenox Ave
- 1069 Caldwell St
- 774 Lenox Ave
- 757 Lenox Ave
- 790 Lenox Ave
- 784 Lenox Ave