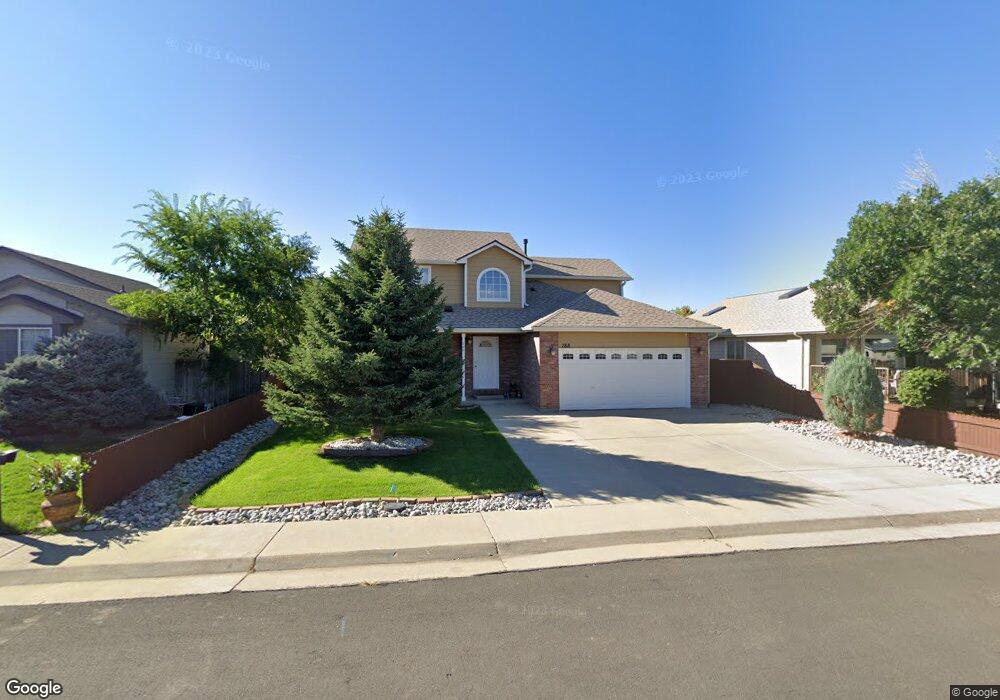
788 S 5th Ct Brighton, CO 80601
Estimated Value: $499,000 - $511,958
3
Beds
3
Baths
2,028
Sq Ft
$249/Sq Ft
Est. Value
About This Home
This home is located at 788 S 5th Ct, Brighton, CO 80601 and is currently estimated at $504,990, approximately $249 per square foot. 788 S 5th Ct is a home located in Adams County with nearby schools including South Elementary School, Vikan Middle School, and Brighton High School.
Ownership History
Date
Name
Owned For
Owner Type
Purchase Details
Closed on
May 2, 2001
Sold by
Snyder Harold and Lund William L
Bought by
Aguirre Noe and Aguirre Rodrigo
Current Estimated Value
Home Financials for this Owner
Home Financials are based on the most recent Mortgage that was taken out on this home.
Original Mortgage
$196,650
Outstanding Balance
$68,814
Interest Rate
6.83%
Estimated Equity
$436,176
Purchase Details
Closed on
Jun 28, 2000
Sold by
Tk Property Investments Lllp
Bought by
Snyder Harold and Lund William L
Create a Home Valuation Report for This Property
The Home Valuation Report is an in-depth analysis detailing your home's value as well as a comparison with similar homes in the area
Home Values in the Area
Average Home Value in this Area
Purchase History
| Date | Buyer | Sale Price | Title Company |
|---|---|---|---|
| Aguirre Noe | $207,000 | -- | |
| Snyder Harold | $38,000 | Land Title |
Source: Public Records
Mortgage History
| Date | Status | Borrower | Loan Amount |
|---|---|---|---|
| Open | Aguirre Noe | $196,650 |
Source: Public Records
Tax History
| Year | Tax Paid | Tax Assessment Tax Assessment Total Assessment is a certain percentage of the fair market value that is determined by local assessors to be the total taxable value of land and additions on the property. | Land | Improvement |
|---|---|---|---|---|
| 2025 | $3,804 | $34,820 | $6,600 | $28,220 |
| 2024 | $3,804 | $32,000 | $6,060 | $25,940 |
| 2023 | $3,775 | $37,350 | $6,160 | $31,190 |
| 2022 | $3,094 | $27,500 | $6,320 | $21,180 |
| 2021 | $2,934 | $27,500 | $6,320 | $21,180 |
| 2020 | $2,833 | $27,760 | $6,510 | $21,250 |
| 2019 | $2,843 | $27,760 | $6,510 | $21,250 |
| 2018 | $2,342 | $22,700 | $5,760 | $16,940 |
| 2017 | $2,314 | $22,700 | $5,760 | $16,940 |
| 2016 | $2,023 | $19,700 | $3,660 | $16,040 |
| 2015 | $2,003 | $19,700 | $3,660 | $16,040 |
| 2014 | $1,745 | $17,360 | $2,870 | $14,490 |
Source: Public Records
Map
Nearby Homes
Your Personal Tour Guide
Ask me questions while you tour the home.