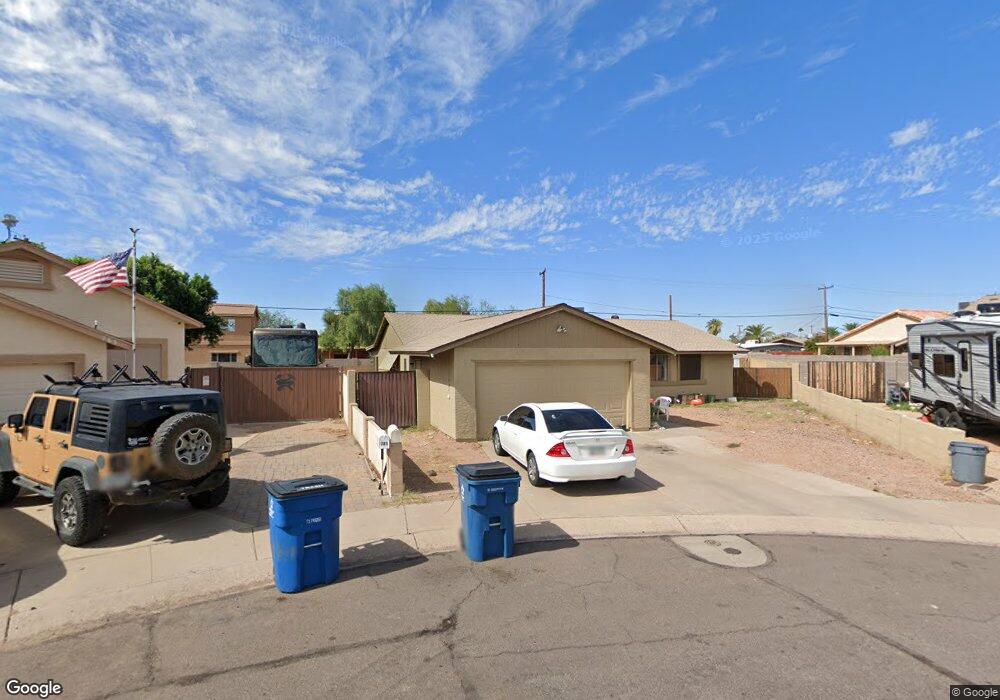
788 W Rosal Cir Apache Junction, AZ 85120
Estimated Value: $285,000 - $350,000
3
Beds
2
Baths
1,352
Sq Ft
$240/Sq Ft
Est. Value
About This Home
This home is located at 788 W Rosal Cir, Apache Junction, AZ 85120 and is currently estimated at $324,693, approximately $240 per square foot. 788 W Rosal Cir is a home located in Pinal County with nearby schools including Desert Vista Elementary School, Cactus Canyon Junior High School, and Apache Junction High School.
Ownership History
Date
Name
Owned For
Owner Type
Purchase Details
Closed on
Sep 7, 2017
Sold by
K And L Funding Company Llc
Bought by
Lin S Investments Llc
Current Estimated Value
Purchase Details
Closed on
Dec 1, 2014
Sold by
Johnson Johnny S
Bought by
Hoots Family Investments
Purchase Details
Closed on
Nov 17, 2010
Sold by
Westburg Kurt
Bought by
Johnson Johany S
Home Financials for this Owner
Home Financials are based on the most recent Mortgage that was taken out on this home.
Original Mortgage
$61,831
Interest Rate
4.21%
Mortgage Type
FHA
Purchase Details
Closed on
Apr 2, 2003
Sold by
Brawn Hans
Bought by
Westburg Kurt
Home Financials for this Owner
Home Financials are based on the most recent Mortgage that was taken out on this home.
Original Mortgage
$110,000
Interest Rate
7.18%
Create a Home Valuation Report for This Property
The Home Valuation Report is an in-depth analysis detailing your home's value as well as a comparison with similar homes in the area
Home Values in the Area
Average Home Value in this Area
Purchase History
| Date | Buyer | Sale Price | Title Company |
|---|---|---|---|
| Lin S Investments Llc | -- | Lawyers Title | |
| Hoots Family Investments | $120,000 | Driggs Title Agency Inc | |
| Johnson Johany S | $63,440 | Lawyers Title Of Arizona Inc | |
| Westburg Kurt | $110,000 | First Financial Title Agency |
Source: Public Records
Mortgage History
| Date | Status | Borrower | Loan Amount |
|---|---|---|---|
| Previous Owner | Johnson Johany S | $61,831 | |
| Previous Owner | Westburg Kurt | $110,000 |
Source: Public Records
Tax History
| Year | Tax Paid | Tax Assessment Tax Assessment Total Assessment is a certain percentage of the fair market value that is determined by local assessors to be the total taxable value of land and additions on the property. | Land | Improvement |
|---|---|---|---|---|
| 2025 | $1,311 | $12,838 | -- | -- |
| 2024 | $1,238 | $14,242 | -- | -- |
| 2023 | $1,291 | $12,876 | $1,100 | $11,776 |
| 2022 | $1,238 | $10,005 | $1,100 | $8,905 |
| 2021 | $1,261 | $9,187 | $0 | $0 |
| 2020 | $1,228 | $9,051 | $0 | $0 |
| 2019 | $1,178 | $8,771 | $0 | $0 |
| 2018 | $1,155 | $8,514 | $0 | $0 |
| 2017 | $1,124 | $8,147 | $0 | $0 |
| 2016 | $1,096 | $8,271 | $1,100 | $7,171 |
Source: Public Records
Map
Nearby Homes
- 723 W 5th Ave Unit 1
- 1059 W 5th Ave
- 720 S Del Rio Ct
- 880 S Buena Vista Dr
- 831 S Phelps Dr
- 894 S Buena Vista Dr
- 854 S San Marcos Dr Unit 7C
- 867 S Del Rio Ct
- 1541 W Yurok Ave
- 1540 W Yurok Ave Unit 540
- 1537 S Omaha Dr Unit 537
- 924 W 10th Ave
- 1188 W Klamath Ave
- 1206 W Klamath Ave
- 2090 S Cherokee Ave
- 1198 W Klamath Ave Unit 198
- 2205 W Klamath Ave
- 2209 W Klamath Ave
- 2072 W Klamath Ave
- 2082 W Klamath Ave
- 772 W Rosal Cir
- 785 W Rosal Ave
- 785 W Rosal Cir
- 769 W Rosal Ave
- 781 W 5th Ave
- 740 W Rosal Cir
- 740 W Rosal Ave
- 795 W 5th Ave
- 769 W Rosal Cir
- 763 W 5th Ave
- 515 S Cardinal Dr
- 722 W Rosal Ave
- 737 W Rosal Cir Unit 2
- 737 W Rosal Ave
- 722 W Rosal Cir
- 741 W 5th Ave
- 719 W Rosal Cir
- 770 W Datil Cir
- 770 W Datil Ave
- 738 W Datil Cir
Your Personal Tour Guide
Ask me questions while you tour the home.