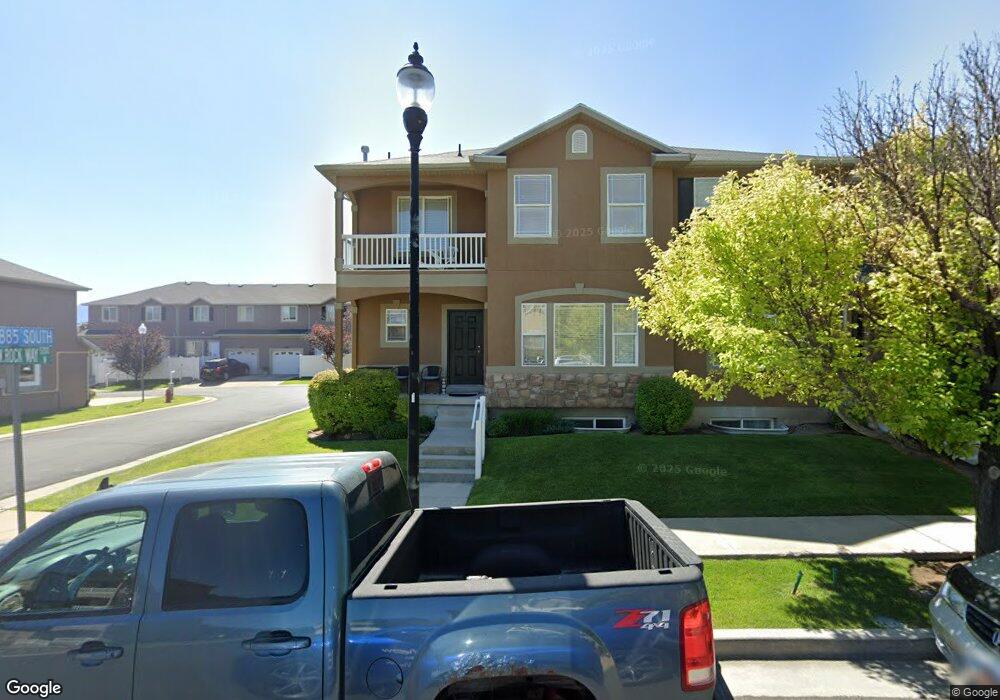
7881 Dove Creek Ln West Jordan, UT 84081
Cobble Creek NeighborhoodEstimated Value: $397,000 - $411,611
3
Beds
3
Baths
1,412
Sq Ft
$286/Sq Ft
Est. Value
About This Home
This home is located at 7881 Dove Creek Ln, West Jordan, UT 84081 and is currently estimated at $403,153, approximately $285 per square foot. 7881 Dove Creek Ln is a home located in Salt Lake County with nearby schools including Hayden Peak Elementary School, West Hills Middle School, and Copper Hills High School.
Ownership History
Date
Name
Owned For
Owner Type
Purchase Details
Closed on
Apr 8, 2009
Sold by
Jordan West
Bought by
Murie Tricia K
Current Estimated Value
Home Financials for this Owner
Home Financials are based on the most recent Mortgage that was taken out on this home.
Original Mortgage
$202,268
Outstanding Balance
$128,687
Interest Rate
5.06%
Mortgage Type
FHA
Estimated Equity
$274,466
Purchase Details
Closed on
Sep 18, 2006
Sold by
Wells Pamela L and Wells Shaun B
Bought by
White Shannon
Home Financials for this Owner
Home Financials are based on the most recent Mortgage that was taken out on this home.
Original Mortgage
$152,000
Interest Rate
6.87%
Mortgage Type
Unknown
Purchase Details
Closed on
Jun 28, 2002
Sold by
Kfp Corp
Bought by
Wells Shaun B and Wells Pamela L
Home Financials for this Owner
Home Financials are based on the most recent Mortgage that was taken out on this home.
Original Mortgage
$151,913
Interest Rate
6.86%
Mortgage Type
FHA
Create a Home Valuation Report for This Property
The Home Valuation Report is an in-depth analysis detailing your home's value as well as a comparison with similar homes in the area
Home Values in the Area
Average Home Value in this Area
Purchase History
| Date | Buyer | Sale Price | Title Company |
|---|---|---|---|
| Murie Tricia K | -- | Hickman Land Title Co | |
| White Shannon | -- | First American Title | |
| Wells Shaun B | -- | Meridian Title |
Source: Public Records
Mortgage History
| Date | Status | Borrower | Loan Amount |
|---|---|---|---|
| Open | Murie Tricia K | $202,268 | |
| Previous Owner | White Shannon | $152,000 | |
| Previous Owner | Wells Shaun B | $151,913 |
Source: Public Records
Tax History Compared to Growth
Tax History
| Year | Tax Paid | Tax Assessment Tax Assessment Total Assessment is a certain percentage of the fair market value that is determined by local assessors to be the total taxable value of land and additions on the property. | Land | Improvement |
|---|---|---|---|---|
| 2025 | $1,919 | $374,600 | $112,400 | $262,200 |
| 2024 | $1,919 | $369,300 | $110,800 | $258,500 |
| 2023 | $1,926 | $349,300 | $104,800 | $244,500 |
| 2022 | $1,980 | $353,300 | $106,000 | $247,300 |
| 2021 | $1,636 | $265,600 | $79,700 | $185,900 |
| 2020 | $1,575 | $240,000 | $72,000 | $168,000 |
| 2019 | $1,509 | $225,500 | $67,600 | $157,900 |
| 2018 | $1,395 | $206,800 | $62,000 | $144,800 |
| 2017 | $1,300 | $191,800 | $57,500 | $134,300 |
| 2016 | $1,257 | $174,300 | $52,300 | $122,000 |
| 2015 | $1,226 | $165,800 | $49,700 | $116,100 |
| 2014 | $1,234 | $164,200 | $49,200 | $115,000 |
Source: Public Records
Map
Nearby Homes
- 7882 S Dove Creek Ln Unit A6
- 5189 W Dove Creek Ln
- 5228 W Ranches Loop Rd
- 7908 Cold Stone Ln Unit N3
- 5183 W Swift Water Way
- 5298 W Icehouse Way
- 7877 S 5440 W Unit 119
- 5422 W Island Creek Dr
- 7414 Regal Hill Dr
- 8322 Copper Vista Cir
- 7563 S Opal Mountain Way W Unit 306
- 7567 S Opal Mountain Way W Unit 307
- 7556 S Opal Mountain Way W Unit 311
- 7569 S Opal Mountain Way W Unit 308
- 7554 S Opal Mountain Way W Unit 310
- 7553 S Opal Mountain Way W Unit 302
- 4678 Emmons Dr
- 8441 S Spratling Dr
- 7507 S 5680 W
- 7288 Comet Hill Cir
- 7883 Dove Creek Ln
- 7877 Dove Creek Ln
- 7887 Dove Creek Ln
- 7887 S Dove Creek Ln
- 7889 S Dove Creek Ln
- 7889 Dove Creek Ln
- 7898 Dove Creek Ln
- 7888 S Dove Creek Ln
- 5202 Dove Creek Ln
- 5202 W Dove Creek Ln
- 7888 Dove Creek Ln
- 7891 S Dove Creek Ln
- 7891 Dove Creek Ln Unit K1
- 7892 Dove Creek Ln
- 7896 Dove Creek Ln
- 7882 Dove Creek Ln Unit A6
- 7882 S Dove Creek Ln
- 5196 W Dove Creek Ln
- 5196 Dove Creek Ln
- 7898 S Dove Creek Ln