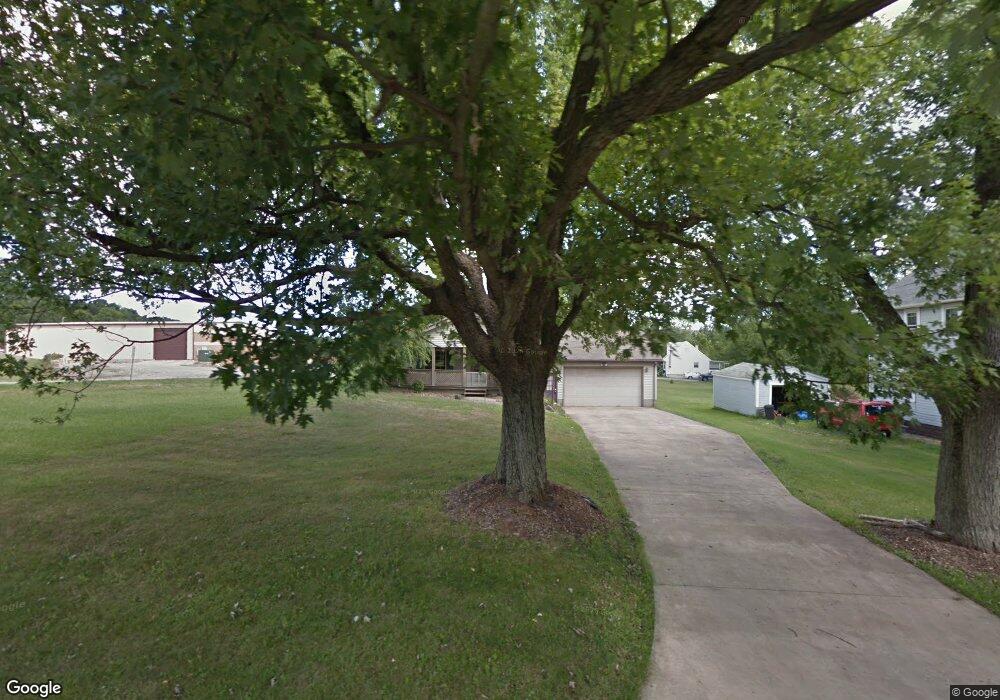
7885 Budd St Masury, OH 44438
Estimated Value: $86,000 - $123,000
2
Beds
1
Bath
854
Sq Ft
$124/Sq Ft
Est. Value
About This Home
This home is located at 7885 Budd St, Masury, OH 44438 and is currently estimated at $105,954, approximately $124 per square foot. 7885 Budd St is a home located in Trumbull County with nearby schools including Brookfield Elementary School, Brookfield Middle School, and Brookfield High School.
Ownership History
Date
Name
Owned For
Owner Type
Purchase Details
Closed on
Sep 16, 2011
Sold by
Kettler John V
Bought by
Ricci Daniel and Ricci Sherry L
Current Estimated Value
Home Financials for this Owner
Home Financials are based on the most recent Mortgage that was taken out on this home.
Original Mortgage
$47,000
Outstanding Balance
$32,283
Interest Rate
4.4%
Mortgage Type
Seller Take Back
Estimated Equity
$73,671
Purchase Details
Closed on
Jun 17, 2010
Sold by
Piccirilli Jodi J
Bought by
Kettler John
Purchase Details
Closed on
Apr 25, 1995
Sold by
Est Frank P Galati
Bought by
Piccirilli Jodi J
Home Financials for this Owner
Home Financials are based on the most recent Mortgage that was taken out on this home.
Original Mortgage
$22,213
Interest Rate
8.64%
Mortgage Type
New Conventional
Create a Home Valuation Report for This Property
The Home Valuation Report is an in-depth analysis detailing your home's value as well as a comparison with similar homes in the area
Purchase History
| Date | Buyer | Sale Price | Title Company |
|---|---|---|---|
| Ricci Daniel | $48,000 | Attorney | |
| Kettler John | $28,556 | None Available | |
| Piccirilli Jodi J | $22,000 | -- |
Source: Public Records
Mortgage History
| Date | Status | Borrower | Loan Amount |
|---|---|---|---|
| Open | Ricci Daniel | $47,000 | |
| Previous Owner | Piccirilli Jodi J | $22,213 |
Source: Public Records
Tax History
| Year | Tax Paid | Tax Assessment Tax Assessment Total Assessment is a certain percentage of the fair market value that is determined by local assessors to be the total taxable value of land and additions on the property. | Land | Improvement |
|---|---|---|---|---|
| 2024 | $1,222 | $26,040 | $2,450 | $23,590 |
| 2023 | $1,222 | $26,040 | $2,450 | $23,590 |
| 2022 | $979 | $16,910 | $2,280 | $14,630 |
| 2021 | $819 | $15,090 | $2,280 | $12,810 |
| 2020 | $990 | $15,090 | $2,280 | $12,810 |
| 2019 | $1,254 | $13,550 | $2,100 | $11,450 |
| 2018 | $971 | $13,550 | $2,100 | $11,450 |
| 2017 | $923 | $13,550 | $2,100 | $11,450 |
| 2016 | $710 | $7,000 | $2,100 | $4,900 |
| 2015 | $665 | $7,000 | $2,100 | $4,900 |
| 2014 | $772 | $7,000 | $2,100 | $4,900 |
| 2013 | $429 | $7,350 | $2,100 | $5,250 |
Source: Public Records
Map
Nearby Homes
- 1017 Broadway St
- 7931 Service St
- 0 Addison Rd Unit 5181382
- 917 S Irvine Ave
- 8198 Erie St
- 780 S Irvine Ave
- 766 S Irvine Ave
- 7647 Connelly Rd
- 676 S State Line Rd
- 672 S Stateline Rd
- 453 Lafayette Ave
- 1400 Thomas Hubbard Rd
- 7304 Oakwood Dr Unit 9
- 7954 Warren - Sharon Rd
- 249 S Irvine Ave
- 331 A St
- 306 Federal St
- 238 Malleable St
- 268 Malleable St
- 279 Fleming Way
Your Personal Tour Guide
Ask me questions while you tour the home.