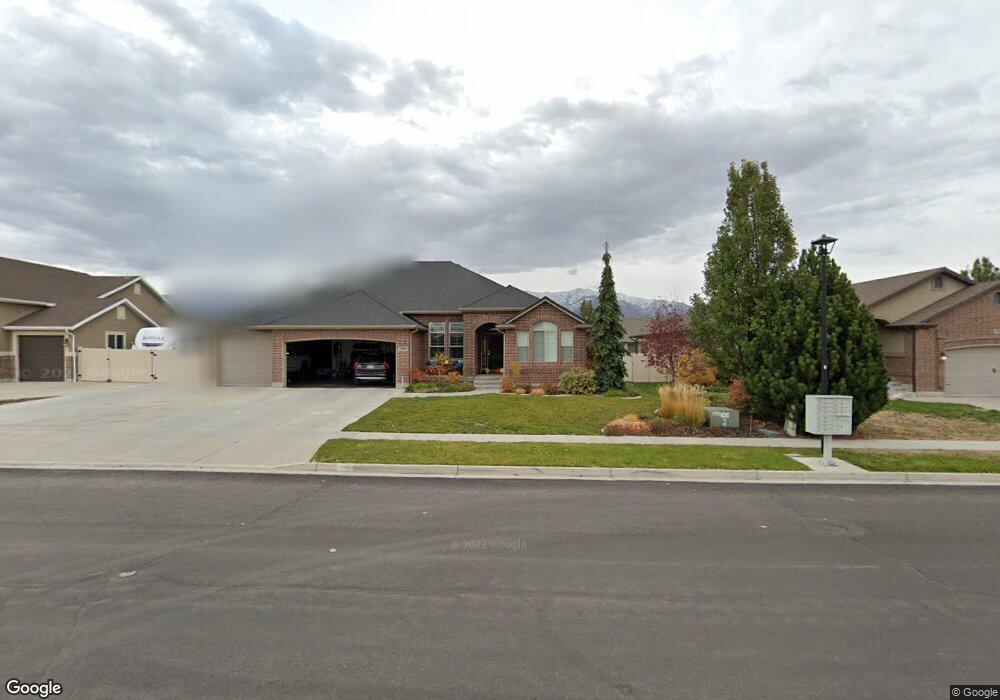
789 Pebble Brook Ln Layton, UT 84041
Estimated Value: $815,000 - $890,276
3
Beds
3
Baths
3,400
Sq Ft
$248/Sq Ft
Est. Value
About This Home
This home is located at 789 Pebble Brook Ln, Layton, UT 84041 and is currently estimated at $844,819, approximately $248 per square foot. 789 Pebble Brook Ln is a home located in Davis County with nearby schools including Heritage Elementary School, Shoreline Junior High School, and Layton High School.
Ownership History
Date
Name
Owned For
Owner Type
Purchase Details
Closed on
Sep 29, 2011
Sold by
Eric Ratcliffe Construction Inc
Bought by
Rognon David E and Rognon Tiffany P
Current Estimated Value
Home Financials for this Owner
Home Financials are based on the most recent Mortgage that was taken out on this home.
Original Mortgage
$292,000
Outstanding Balance
$198,174
Interest Rate
4.15%
Mortgage Type
New Conventional
Estimated Equity
$646,645
Purchase Details
Closed on
Apr 26, 2011
Sold by
L Dale Green Construction Inc
Bought by
Eric Ratcliffe Construction Inc
Home Financials for this Owner
Home Financials are based on the most recent Mortgage that was taken out on this home.
Original Mortgage
$324,300
Interest Rate
10%
Mortgage Type
Purchase Money Mortgage
Purchase Details
Closed on
Jan 23, 2008
Sold by
Green & Green Lc
Bought by
L Dale Green Construction Inc
Create a Home Valuation Report for This Property
The Home Valuation Report is an in-depth analysis detailing your home's value as well as a comparison with similar homes in the area
Home Values in the Area
Average Home Value in this Area
Purchase History
| Date | Buyer | Sale Price | Title Company |
|---|---|---|---|
| Rognon David E | -- | Security Title Of Dav | |
| Eric Ratcliffe Construction Inc | -- | Accommodation | |
| L Dale Green Construction Inc | -- | Security Title |
Source: Public Records
Mortgage History
| Date | Status | Borrower | Loan Amount |
|---|---|---|---|
| Open | Rognon David E | $292,000 | |
| Closed | Rognon David E | $36,500 | |
| Previous Owner | Eric Ratcliffe Construction Inc | $324,300 |
Source: Public Records
Tax History Compared to Growth
Tax History
| Year | Tax Paid | Tax Assessment Tax Assessment Total Assessment is a certain percentage of the fair market value that is determined by local assessors to be the total taxable value of land and additions on the property. | Land | Improvement |
|---|---|---|---|---|
| 2025 | $4,606 | $483,450 | $123,902 | $359,548 |
| 2024 | $4,380 | $463,100 | $134,239 | $328,861 |
| 2023 | $4,292 | $800,000 | $138,534 | $661,466 |
| 2022 | $4,054 | $410,300 | $82,795 | $327,505 |
| 2021 | $3,670 | $554,000 | $124,191 | $429,809 |
| 2020 | $3,315 | $480,000 | $105,497 | $374,503 |
| 2019 | $3,215 | $456,000 | $105,815 | $350,185 |
| 2018 | $2,957 | $421,000 | $93,075 | $327,925 |
| 2016 | $2,702 | $198,495 | $37,810 | $160,685 |
| 2015 | $2,745 | $191,455 | $37,810 | $153,645 |
| 2014 | $2,583 | $184,180 | $37,810 | $146,370 |
| 2013 | -- | $170,500 | $37,058 | $133,442 |
Source: Public Records
Map
Nearby Homes
- 796 S Rock Creek Corner
- 557 S Angel St
- 920 S 1700 W Unit 1
- 583 S Alberta Spruce Dr
- Creighton Farmhouse Plan at Angel Hill
- 1042 W Shoreline Dr
- 1124 S Neville St
- 1038 S Old Towne Rd
- 1234 S Grace Way
- 1278 S Grace Way
- 1015 W 350 S
- 562 S 850 W
- 362 S 950 W
- 774 W Farming Way
- 296 S 950 W
- 2182 W Evergreen Way Unit 143
- 1494 S Mica Ln
- 2056 W Phillips St
- 37 N Swift Creek Dr
- 1910 W Bonneville Ln
- 771 Pebble Brook Ln Unit 614
- 805 Pebble Brook Ln
- 771 Pebble Brook Ln
- 788 Stone Creek Corner
- 806 Stone Creek Corner
- 821 Pebble Brook Ln
- 1486 Boulder Creek Ln
- 774 S Pebble Brook Ln Unit 613
- 822 Stone Creek Corner
- 780 Stone Creek Corner
- 839 Pebble Brook Ln
- 1504 Boulder Creek Ln
- 1428 W Timbercreek Ln
- 1507 Boulder Creek Ln
- 1457 W 725 S
- 1439 W 725 S
- 807 Stone Creek
- 807 Stone Creek Corner
- 791 Stone Creek Corner
- 1487 W 725 S