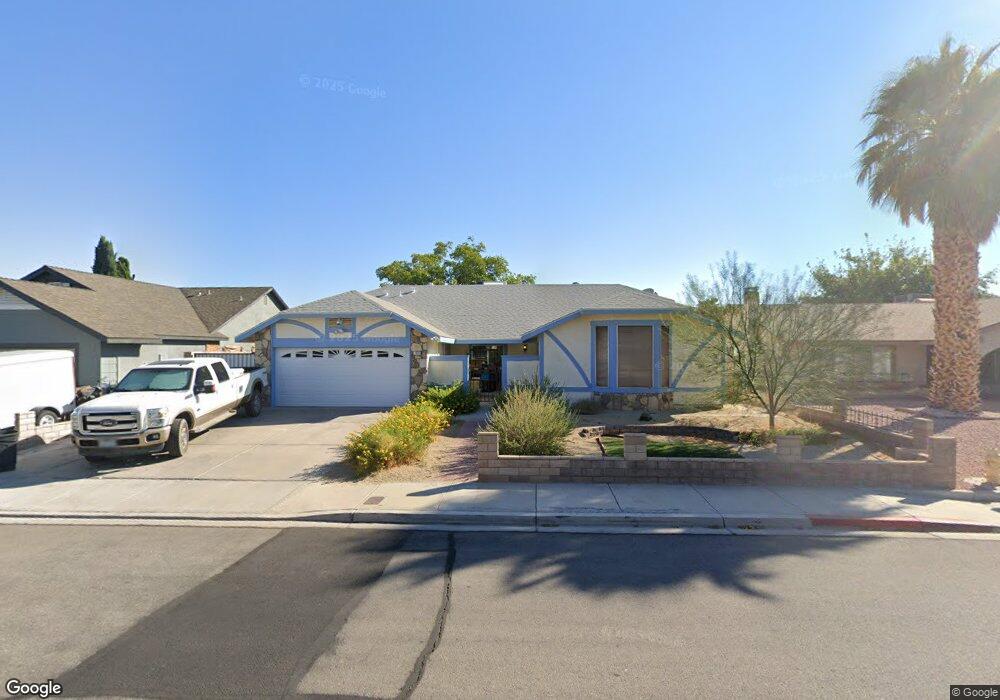
789 Shirley Ln Boulder City, NV 89005
Estimated Value: $503,362 - $548,000
3
Beds
2
Baths
1,785
Sq Ft
$298/Sq Ft
Est. Value
About This Home
This home is located at 789 Shirley Ln, Boulder City, NV 89005 and is currently estimated at $532,341, approximately $298 per square foot. 789 Shirley Ln is a home located in Clark County with nearby schools including Andrew Mitchell Elementary School, Martha P. King Elementary School, and Elton M. & Madelaine E. Garrett Junior High School.
Ownership History
Date
Name
Owned For
Owner Type
Purchase Details
Closed on
Nov 9, 1998
Sold by
The Gillig Family Ltd Partnership
Bought by
Hatch Richard A and Garlow Hatch Cynthia J
Current Estimated Value
Home Financials for this Owner
Home Financials are based on the most recent Mortgage that was taken out on this home.
Original Mortgage
$165,000
Outstanding Balance
$36,808
Interest Rate
6.84%
Mortgage Type
VA
Estimated Equity
$495,533
Purchase Details
Closed on
Aug 7, 1998
Sold by
Connell Joseph M and Connell Lynn
Bought by
Connell Joseph M and Connell Lynn
Purchase Details
Closed on
Oct 9, 1996
Sold by
Gillig Stephen C
Bought by
The Gillig Family Ltd Partnership
Purchase Details
Closed on
Sep 12, 1995
Sold by
Cannon Richard E and Cannon Barbara E
Bought by
Gillig Steven C
Home Financials for this Owner
Home Financials are based on the most recent Mortgage that was taken out on this home.
Original Mortgage
$161,365
Interest Rate
7.59%
Create a Home Valuation Report for This Property
The Home Valuation Report is an in-depth analysis detailing your home's value as well as a comparison with similar homes in the area
Home Values in the Area
Average Home Value in this Area
Purchase History
| Date | Buyer | Sale Price | Title Company |
|---|---|---|---|
| Hatch Richard A | $165,000 | United Title | |
| Connell Joseph M | -- | -- | |
| The Gillig Family Ltd Partnership | $161,500 | United Title | |
| Gillig Steven C | $160,000 | United Title |
Source: Public Records
Mortgage History
| Date | Status | Borrower | Loan Amount |
|---|---|---|---|
| Open | Hatch Richard A | $165,000 | |
| Previous Owner | Gillig Steven C | $161,365 |
Source: Public Records
Tax History Compared to Growth
Tax History
| Year | Tax Paid | Tax Assessment Tax Assessment Total Assessment is a certain percentage of the fair market value that is determined by local assessors to be the total taxable value of land and additions on the property. | Land | Improvement |
|---|---|---|---|---|
| 2025 | $1,734 | $89,246 | $51,800 | $37,446 |
| 2024 | $1,684 | $89,246 | $51,800 | $37,446 |
| 2023 | $1,684 | $76,642 | $39,900 | $36,742 |
| 2022 | $1,635 | $69,284 | $35,000 | $34,284 |
| 2021 | $1,587 | $63,686 | $30,450 | $33,236 |
| 2020 | $1,541 | $63,965 | $30,450 | $33,515 |
| 2019 | $1,522 | $59,792 | $26,250 | $33,542 |
| 2018 | $1,452 | $55,876 | $23,100 | $32,776 |
| 2017 | $1,475 | $56,485 | $22,750 | $33,735 |
| 2016 | $1,359 | $54,856 | $20,300 | $34,556 |
| 2015 | $1,356 | $52,068 | $17,500 | $34,568 |
| 2014 | $1,316 | $49,336 | $15,750 | $33,586 |
Source: Public Records
Map
Nearby Homes
- 798 Fairway Dr
- 1546 Georgia Ave
- 893 Fairway Dr
- 1527 Irene Dr
- 782 Sandra Dr
- 1316 Capri Dr Unit A,B,C,&D
- 1413 Pueblo Dr
- 1321 Nadine Way
- 976 El Camino Way
- 1427 San Felipe Dr
- 1000 Legacy Dr
- 1303 Darlene Way Unit 105C
- 1303 Darlene Way Unit 102B
- 1300 Georgia Ave Unit A
- 1010 Legacy Dr
- 839 Benita Place
- 1437 Cattail Falls St
- 1505 Carlsbad St
- 834 Benita Place
- 873 Montera Ln