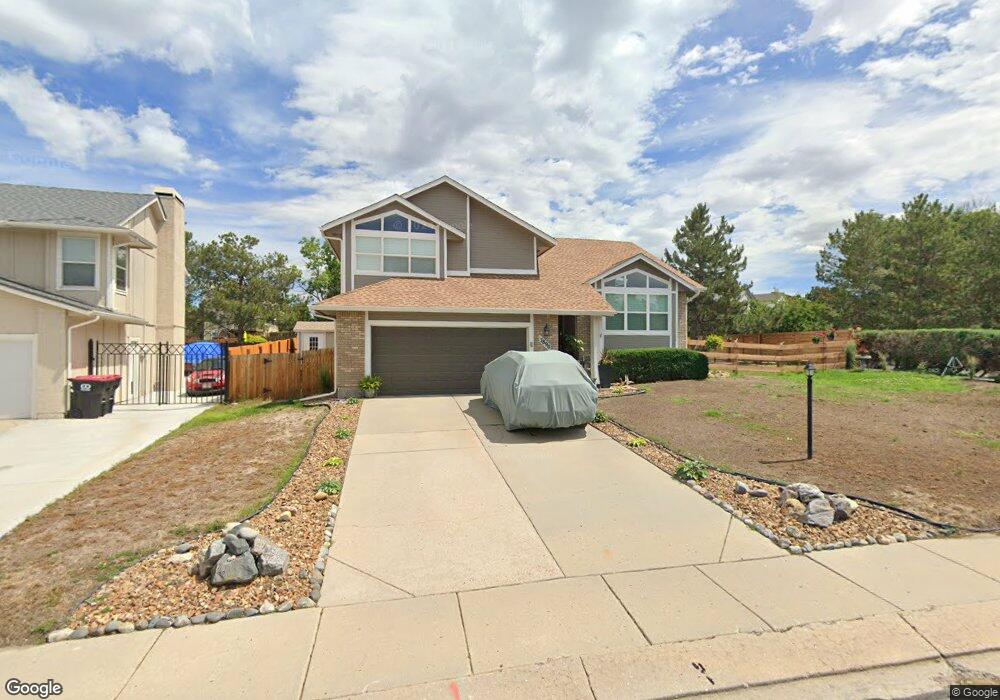
7890 Conifer Dr Colorado Springs, CO 80920
Briargate NeighborhoodEstimated Value: $466,000 - $521,000
3
Beds
2
Baths
1,403
Sq Ft
$352/Sq Ft
Est. Value
About This Home
This home is located at 7890 Conifer Dr, Colorado Springs, CO 80920 and is currently estimated at $494,194, approximately $352 per square foot. 7890 Conifer Dr is a home located in El Paso County with nearby schools including Frontier Elementary School, Timberview Middle School, and Liberty High School.
Ownership History
Date
Name
Owned For
Owner Type
Purchase Details
Closed on
Dec 17, 2021
Sold by
Ff 2020 Llc
Bought by
Ross Gustine
Current Estimated Value
Home Financials for this Owner
Home Financials are based on the most recent Mortgage that was taken out on this home.
Original Mortgage
$475,000
Outstanding Balance
$436,934
Interest Rate
3.12%
Mortgage Type
VA
Estimated Equity
$57,260
Purchase Details
Closed on
Jul 30, 2021
Sold by
Murray Judith A
Bought by
Ff 2020 Llc
Home Financials for this Owner
Home Financials are based on the most recent Mortgage that was taken out on this home.
Original Mortgage
$300,541
Interest Rate
2.93%
Mortgage Type
Commercial
Purchase Details
Closed on
Jul 18, 1988
Bought by
Murray Donald W and Murray Judith A
Purchase Details
Closed on
Mar 1, 1984
Bought by
Murray Donald W and Murray Judith A
Create a Home Valuation Report for This Property
The Home Valuation Report is an in-depth analysis detailing your home's value as well as a comparison with similar homes in the area
Home Values in the Area
Average Home Value in this Area
Purchase History
| Date | Buyer | Sale Price | Title Company |
|---|---|---|---|
| Ross Gustine | $475,000 | Legacy Title Group Llc | |
| Ross Gustine | $475,000 | Legacy Title Group Llc | |
| Ff 2020 Llc | $375,000 | Legacy Title Group Llc | |
| Murray Donald W | -- | -- | |
| Murray Donald W | -- | -- |
Source: Public Records
Mortgage History
| Date | Status | Borrower | Loan Amount |
|---|---|---|---|
| Open | Ross Gustine | $475,000 | |
| Closed | Ross Gustine | $475,000 | |
| Previous Owner | Ff 2020 Llc | $300,541 |
Source: Public Records
Tax History Compared to Growth
Tax History
| Year | Tax Paid | Tax Assessment Tax Assessment Total Assessment is a certain percentage of the fair market value that is determined by local assessors to be the total taxable value of land and additions on the property. | Land | Improvement |
|---|---|---|---|---|
| 2025 | $2,050 | $34,360 | -- | -- |
| 2024 | $1,562 | $35,700 | $5,360 | $30,340 |
| 2023 | $1,562 | $35,700 | $5,360 | $30,340 |
| 2022 | $1,631 | $23,110 | $4,340 | $18,770 |
| 2021 | $1,803 | $23,770 | $4,460 | $19,310 |
| 2020 | $1,759 | $21,610 | $3,720 | $17,890 |
| 2019 | $1,741 | $21,610 | $3,720 | $17,890 |
| 2018 | $1,462 | $17,850 | $2,880 | $14,970 |
| 2017 | $1,457 | $17,850 | $2,880 | $14,970 |
| 2016 | $1,388 | $16,990 | $2,930 | $14,060 |
| 2015 | $1,386 | $16,990 | $2,930 | $14,060 |
| 2014 | $1,215 | $15,730 | $2,930 | $12,800 |
Source: Public Records
Map
Nearby Homes
- 4035 Scotch Pine Dr
- 7866 Brandy Cir
- 3895 Beltana Dr
- 4255 Scotch Pine Dr
- 3855 Beltana Dr
- 3845 Beltana Dr
- 4955 Ramblewood Dr
- 4120 Limberwood Ct
- 8110 Lythrum Dr
- 8261 Cooper River Dr
- 3920 Smoke Tree Dr
- 3906 Smoke Tree Dr
- 3915 Smoke Tree Dr
- 3755 Brisbane Dr
- 3909 Smoke Tree Dr
- 7870 Chimney Terrace
- 3839 Smoke Tree Dr
- 8118 Ravenel Dr
- 4315 Basswood Dr
- 8330 Pepperridge Dr
- 7880 Conifer Dr
- 7870 Conifer Dr
- 7910 Conifer Dr
- 7885 Conifer Dr
- 7865 Conifer Dr
- 8590 Avens Cir
- 8610 Avens Cir
- 8580 Avens Cir
- 8620 Avens Cir
- 7845 Conifer Dr
- 7860 Conifer Dr
- 7860 Montane Dr
- 8630 Avens Cir
- 8570 Avens Cir
- 7865 Montane Dr
- 7840 Conifer Dr
- 7850 Conifer Dr
- 7930 Conifer Dr
- 7825 Conifer Dr
- 4415 Scotch Pine Dr