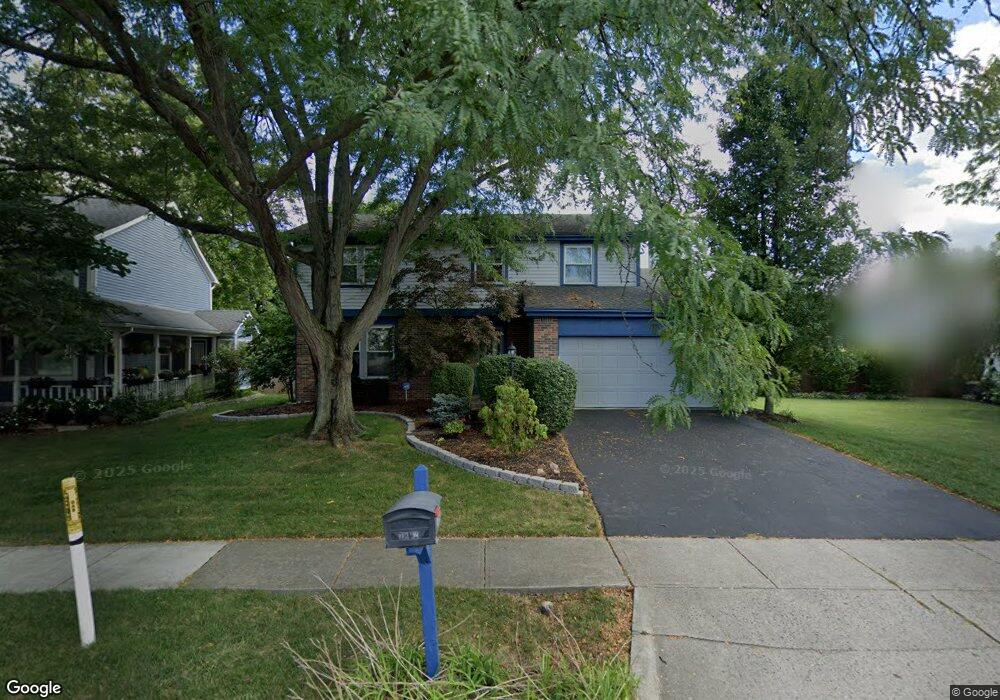
7892 Stanburn Rd Columbus, OH 43235
Foxboro NeighborhoodEstimated Value: $330,000 - $452,000
4
Beds
3
Baths
1,872
Sq Ft
$217/Sq Ft
Est. Value
About This Home
This home is located at 7892 Stanburn Rd, Columbus, OH 43235 and is currently estimated at $405,713, approximately $216 per square foot. 7892 Stanburn Rd is a home located in Franklin County with nearby schools including Albert Chapman Elementary School, Ann Simpson Davis Middle School, and Dublin Scioto High School.
Ownership History
Date
Name
Owned For
Owner Type
Purchase Details
Closed on
Mar 5, 2003
Sold by
Kuhlman Michelle C
Bought by
Kuhlman Michelle C
Current Estimated Value
Home Financials for this Owner
Home Financials are based on the most recent Mortgage that was taken out on this home.
Original Mortgage
$100,500
Interest Rate
6%
Mortgage Type
New Conventional
Purchase Details
Closed on
Sep 25, 1995
Sold by
Koushik Srinivas
Bought by
Michelle C Kuhlman
Home Financials for this Owner
Home Financials are based on the most recent Mortgage that was taken out on this home.
Original Mortgage
$85,000
Interest Rate
7.78%
Mortgage Type
New Conventional
Purchase Details
Closed on
Jul 21, 1992
Create a Home Valuation Report for This Property
The Home Valuation Report is an in-depth analysis detailing your home's value as well as a comparison with similar homes in the area
Home Values in the Area
Average Home Value in this Area
Purchase History
| Date | Buyer | Sale Price | Title Company |
|---|---|---|---|
| Kuhlman Michelle C | $148,000 | -- | |
| Michelle C Kuhlman | $125,000 | -- | |
| -- | $116,300 | -- |
Source: Public Records
Mortgage History
| Date | Status | Borrower | Loan Amount |
|---|---|---|---|
| Closed | Kuhlman Michelle C | $100,500 | |
| Previous Owner | Michelle C Kuhlman | $85,000 |
Source: Public Records
Tax History
| Year | Tax Paid | Tax Assessment Tax Assessment Total Assessment is a certain percentage of the fair market value that is determined by local assessors to be the total taxable value of land and additions on the property. | Land | Improvement |
|---|---|---|---|---|
| 2025 | $6,711 | $110,960 | $38,260 | $72,700 |
| 2024 | $6,711 | $110,960 | $38,260 | $72,700 |
| 2023 | $6,617 | $110,950 | $38,255 | $72,695 |
| 2022 | $6,073 | $94,650 | $21,530 | $73,120 |
| 2021 | $6,172 | $94,650 | $21,530 | $73,120 |
| 2020 | $6,135 | $94,650 | $21,530 | $73,120 |
| 2019 | $5,668 | $77,420 | $17,920 | $59,500 |
| 2018 | $5,135 | $77,420 | $17,920 | $59,500 |
| 2017 | $5,233 | $77,420 | $17,920 | $59,500 |
| 2016 | $4,551 | $63,250 | $15,440 | $47,810 |
| 2015 | $4,580 | $63,250 | $15,440 | $47,810 |
| 2014 | $4,584 | $63,250 | $15,440 | $47,810 |
| 2013 | $2,327 | $63,245 | $15,435 | $47,810 |
Source: Public Records
Map
Nearby Homes
- 2469 Sandstrom Dr
- 7641 Old Foxe Ct
- 7480 Gardenview Place
- 7887 Thornfield Ln Unit 50
- 7891 Thornfield Ln Unit 48
- 7912 Meadowhaven Blvd Unit 30
- 7847 Meadowhaven Blvd Unit 66
- 7853 Meadowhaven Blvd Unit 63
- 7735 Schoolway Ct
- 2074 Hard Rd
- 2026 Sawbury Blvd
- 2024 Sawbury Blvd
- 7685 Starmont Ct
- 2001 Sawbury Blvd Unit 2001
- 7187 Inverness Ct Unit 7187
- 3915 Inverness Cir Unit 3915
- 7965 Boothbay Ct Unit 20
- 1978 Shallowford Ave
- 3827 Carberry Dr Unit 3827
- 6924 Spruce Pine Dr
- 7900 Stanburn Rd
- 2432 Bradenton Ct
- 7884 Stanburn Rd
- 2407 Queen Ann Ct
- 2438 Bradenton Ct
- 2430 Bradenton Ct
- 2414 Bradenton Ct
- 2428 Bradenton Ct
- 2406 Bradenton Ct
- 2399 Queen Ann Ct
- 7908 Stanburn Rd
- 2415 Queen Ann Ct
- 2391 Hard Rd
- 7903 Stanburn Rd
- 2391 Queen Ann Ct
- 2422 Bradenton Ct
- 2422 Bradenton Ct
- 7895 Stanburn Rd
- 2423 Queen Ann Ct
- 2433 Bradenton Ct
Your Personal Tour Guide
Ask me questions while you tour the home.