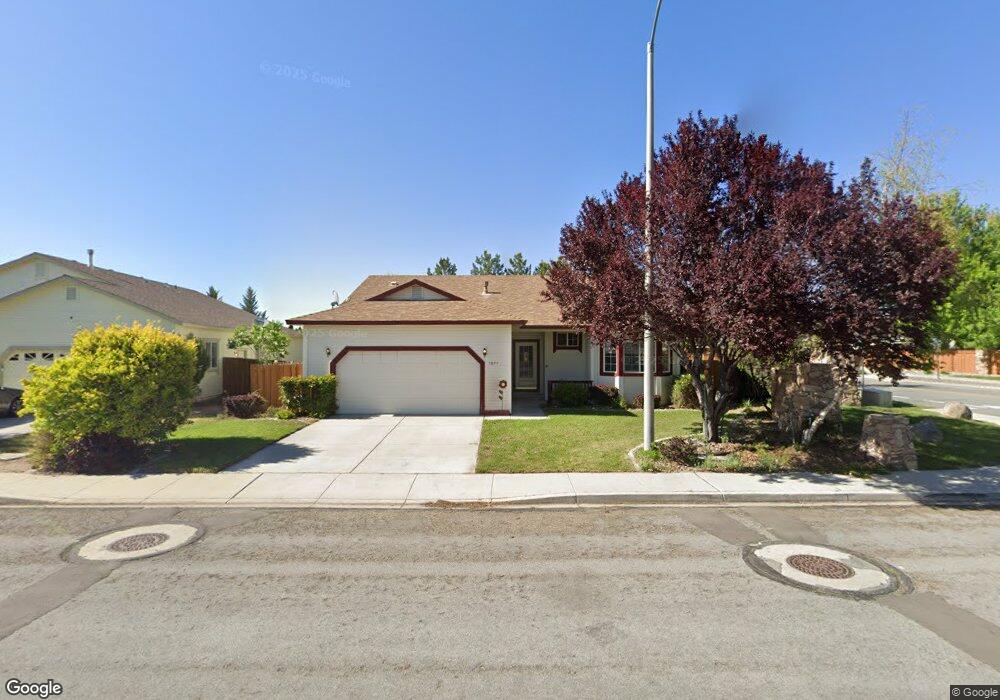
7899 Jacinto Ave Sparks, NV 89436
Wingfield Springs NeighborhoodEstimated Value: $476,611 - $507,000
3
Beds
2
Baths
1,426
Sq Ft
$348/Sq Ft
Est. Value
About This Home
This home is located at 7899 Jacinto Ave, Sparks, NV 89436 and is currently estimated at $496,903, approximately $348 per square foot. 7899 Jacinto Ave is a home located in Washoe County with nearby schools including Van Gorder Elementary School, Sky Ranch Middle School, and Spanish Springs High School.
Ownership History
Date
Name
Owned For
Owner Type
Purchase Details
Closed on
May 5, 2005
Sold by
Smith Laurie C and Vill Laurie C
Bought by
Smith Laurie C and The Laurie C Vill Trust
Current Estimated Value
Home Financials for this Owner
Home Financials are based on the most recent Mortgage that was taken out on this home.
Original Mortgage
$25,000
Interest Rate
5.87%
Mortgage Type
Credit Line Revolving
Purchase Details
Closed on
Oct 28, 2002
Sold by
Vill Laurie C
Bought by
Vill Laurie C and Laurie C Vill Trust
Purchase Details
Closed on
Aug 1, 2000
Sold by
J E Morros Construction & Development Co
Bought by
Vill Laurie C
Home Financials for this Owner
Home Financials are based on the most recent Mortgage that was taken out on this home.
Original Mortgage
$133,200
Interest Rate
8.19%
Create a Home Valuation Report for This Property
The Home Valuation Report is an in-depth analysis detailing your home's value as well as a comparison with similar homes in the area
Home Values in the Area
Average Home Value in this Area
Purchase History
| Date | Buyer | Sale Price | Title Company |
|---|---|---|---|
| Smith Laurie C | -- | -- | |
| Smith Laurie C | -- | Ticor Title Of Nevada Inc | |
| Smith Laurie C | -- | Ticor Title Of Nevada Inc | |
| Vill Laurie C | -- | -- | |
| Vill Laurie C | $148,000 | Stewart Title Northern Nevad |
Source: Public Records
Mortgage History
| Date | Status | Borrower | Loan Amount |
|---|---|---|---|
| Closed | Smith Laurie C | $25,000 | |
| Previous Owner | Vill Laurie C | $133,200 |
Source: Public Records
Tax History Compared to Growth
Tax History
| Year | Tax Paid | Tax Assessment Tax Assessment Total Assessment is a certain percentage of the fair market value that is determined by local assessors to be the total taxable value of land and additions on the property. | Land | Improvement |
|---|---|---|---|---|
| 2025 | $2,783 | $94,702 | $36,855 | $57,847 |
| 2024 | $2,783 | $90,604 | $32,200 | $58,404 |
| 2023 | $2,578 | $91,990 | $36,750 | $55,240 |
| 2022 | $2,388 | $74,532 | $28,490 | $46,043 |
| 2021 | $2,210 | $68,858 | $22,995 | $45,863 |
| 2020 | $2,078 | $69,622 | $23,625 | $45,997 |
| 2019 | $1,978 | $66,484 | $21,875 | $44,609 |
| 2018 | $1,888 | $59,490 | $15,785 | $43,705 |
| 2017 | $1,813 | $59,187 | $15,365 | $43,822 |
| 2016 | $1,767 | $58,404 | $13,685 | $44,719 |
| 2015 | $1,763 | $58,185 | $13,405 | $44,780 |
| 2014 | $1,709 | $53,521 | $10,430 | $43,091 |
| 2013 | -- | $44,309 | $8,155 | $36,154 |
Source: Public Records
Map
Nearby Homes
- 7859 Guerra Ct
- 7827 Morro Ave
- 7861 Cantabria Dr
- 7850 Morro Ave
- 7685 Avila Ct
- 7706 Cerritos Cir
- 3123 Minino Ct
- 7980 Teruel Ct
- 3110 Rama Ct
- 3131 Manzana Ct
- 7368 S Florentine Dr
- 7366 Grand Island Dr
- 7718 Rhythm Cir
- 7635 Badelona Ct
- 8080 Tres Arroyos Ct
- 3461 Tavira Ct
- 7420 Island Queen Dr
- 7476 Lorna Ln
- 2850 Billie Dove Ct
- 3663 Copernicus Ct
- 7895 Jacinto Ave
- 7505 Los Lagos Ave
- 7891 Jacinto Ave
- 7898 Jacinto Ave
- 7892 Jacinto Ave
- 3299 Genil Ct Unit 2
- 7887 Jacinto Ave
- 7525 Los Lagos Ave
- 3244 Apio Ct
- 3294 Genil Ct
- 7808 Cangrejo Ct
- 7880 Jacinto Ave
- 3240 Perla Ct
- 3295 Genil Ct Unit 2
- 7883 Jacinto Ave
- 3234 Apio Ct
- 7818 Cangrejo Ct
- 7535 Los Lagos Ave
- 3288 Genil Ct
- 7879 Jacinto Ave