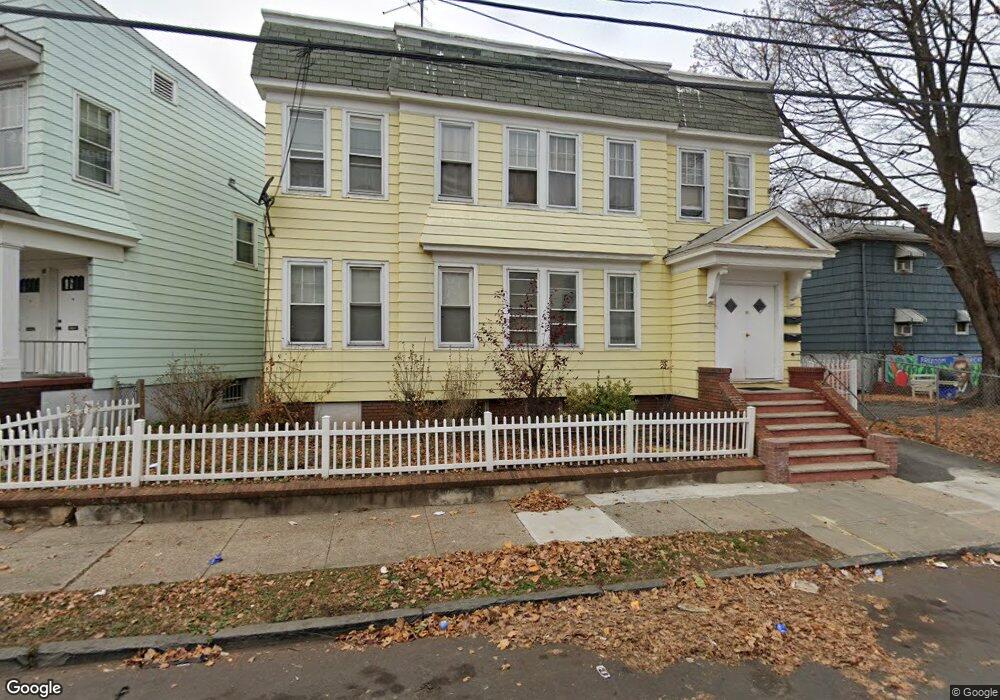
79 21st St Unit 81 Irvington, NJ 07111
Estimated Value: $564,670 - $668,000
--
Bed
--
Bath
2,968
Sq Ft
$207/Sq Ft
Est. Value
About This Home
This home is located at 79 21st St Unit 81, Irvington, NJ 07111 and is currently estimated at $613,168, approximately $206 per square foot. 79 21st St Unit 81 is a home located in Essex County with nearby schools including Irvington High School.
Ownership History
Date
Name
Owned For
Owner Type
Purchase Details
Closed on
Apr 8, 2021
Sold by
George Mary
Bought by
George Sheldon
Current Estimated Value
Purchase Details
Closed on
Oct 10, 2001
Sold by
Billings Samuel
Bought by
George Sheldon
Home Financials for this Owner
Home Financials are based on the most recent Mortgage that was taken out on this home.
Original Mortgage
$114,098
Interest Rate
6.82%
Mortgage Type
FHA
Purchase Details
Closed on
Jul 1, 1990
Sold by
Billings Samuel and Marilyn Et Als
Bought by
Billings Samuel and Billings Marilyn
Create a Home Valuation Report for This Property
The Home Valuation Report is an in-depth analysis detailing your home's value as well as a comparison with similar homes in the area
Home Values in the Area
Average Home Value in this Area
Purchase History
| Date | Buyer | Sale Price | Title Company |
|---|---|---|---|
| George Sheldon | -- | None Listed On Document | |
| George Sheldon | $115,000 | -- | |
| Billings Samuel | -- | -- |
Source: Public Records
Mortgage History
| Date | Status | Borrower | Loan Amount |
|---|---|---|---|
| Previous Owner | George Sheldon | $114,098 |
Source: Public Records
Tax History Compared to Growth
Tax History
| Year | Tax Paid | Tax Assessment Tax Assessment Total Assessment is a certain percentage of the fair market value that is determined by local assessors to be the total taxable value of land and additions on the property. | Land | Improvement |
|---|---|---|---|---|
| 2025 | $8,010 | $497,100 | $130,900 | $366,200 |
| 2024 | $8,010 | $131,900 | $17,300 | $114,600 |
| 2022 | $7,863 | $131,900 | $17,300 | $114,600 |
| 2021 | $7,886 | $131,900 | $17,300 | $114,600 |
| 2020 | $7,882 | $131,900 | $17,300 | $114,600 |
| 2019 | $7,669 | $131,900 | $17,300 | $114,600 |
| 2018 | $7,520 | $131,900 | $17,300 | $114,600 |
| 2017 | $7,485 | $131,900 | $17,300 | $114,600 |
| 2016 | $7,323 | $131,900 | $17,300 | $114,600 |
| 2015 | $7,153 | $131,900 | $17,300 | $114,600 |
| 2014 | $7,196 | $131,900 | $17,300 | $114,600 |
Source: Public Records
Map
Nearby Homes
- 369 14th Ave
- 502 S 20th St
- 500 S 20th St Unit 502
- 443 Grove St
- 431-433 S 18th St
- 431-433 S 18th St Unit 4
- 408-410 S 19th St
- 392 S 19th St
- 535 S 18th St
- 537 S 18th St
- 21 Gladstone Ave
- 553 S Orange Ave
- 550-552 S 19th St
- 512 S 17th St
- 595 15th Ave
- 22 Speedway Ave
- 440 S 16th St
- 413 S 16th St
- 484 S 19th St
- 486 S 19th St