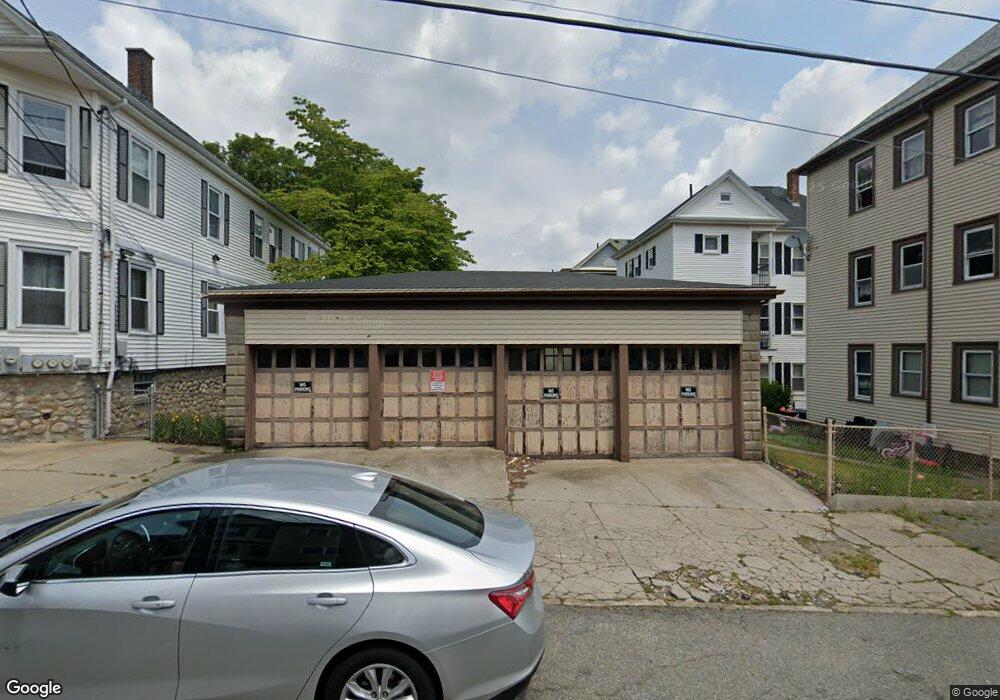
79 Adams St New Bedford, MA 02746
Riverside Park NeighborhoodEstimated Value: $556,000 - $595,000
7
Beds
3
Baths
3,032
Sq Ft
$190/Sq Ft
Est. Value
About This Home
This home is located at 79 Adams St, New Bedford, MA 02746 and is currently estimated at $576,667, approximately $190 per square foot. 79 Adams St is a home located in Bristol County with nearby schools including Hayden McFadden Elementary School, Keith Middle School, and New Bedford High School.
Ownership History
Date
Name
Owned For
Owner Type
Purchase Details
Closed on
Jul 17, 2008
Sold by
Hsbc Bank Usa
Bought by
Alves Miguel A
Current Estimated Value
Home Financials for this Owner
Home Financials are based on the most recent Mortgage that was taken out on this home.
Original Mortgage
$43,000
Outstanding Balance
$27,881
Interest Rate
6.17%
Estimated Equity
$548,786
Purchase Details
Closed on
Mar 28, 2008
Sold by
Alves Jose C
Bought by
Hsbc Bank Usa
Purchase Details
Closed on
Nov 24, 2006
Sold by
Decampos Luis Philip and Decampos Maria
Bought by
Alves Jose C
Create a Home Valuation Report for This Property
The Home Valuation Report is an in-depth analysis detailing your home's value as well as a comparison with similar homes in the area
Home Values in the Area
Average Home Value in this Area
Purchase History
| Date | Buyer | Sale Price | Title Company |
|---|---|---|---|
| Alves Miguel A | $232,000 | -- | |
| Alves Miguel A | $232,000 | -- | |
| Hsbc Bank Usa | $250,314 | -- | |
| Hsbc Bank Usa | $250,314 | -- | |
| Alves Jose C | $331,000 | -- | |
| Alves Jose C | $331,000 | -- |
Source: Public Records
Mortgage History
| Date | Status | Borrower | Loan Amount |
|---|---|---|---|
| Open | Alves Jose C | $43,000 | |
| Open | Alves Jose C | $134,100 |
Source: Public Records
Tax History Compared to Growth
Tax History
| Year | Tax Paid | Tax Assessment Tax Assessment Total Assessment is a certain percentage of the fair market value that is determined by local assessors to be the total taxable value of land and additions on the property. | Land | Improvement |
|---|---|---|---|---|
| 2025 | $5,969 | $527,800 | $105,700 | $422,100 |
| 2024 | $5,210 | $434,200 | $90,300 | $343,900 |
| 2023 | $4,534 | $317,300 | $75,600 | $241,700 |
| 2022 | $4,115 | $264,800 | $69,100 | $195,700 |
| 2021 | $4,032 | $258,600 | $69,100 | $189,500 |
| 2020 | $3,990 | $246,900 | $69,100 | $177,800 |
| 2019 | $3,528 | $214,200 | $69,100 | $145,100 |
| 2018 | $3,388 | $203,700 | $69,100 | $134,600 |
| 2017 | $3,179 | $190,500 | $69,100 | $121,400 |
| 2016 | $3,070 | $186,200 | $69,100 | $117,100 |
| 2015 | $2,875 | $182,800 | $69,100 | $113,700 |
| 2014 | $2,771 | $182,800 | $69,100 | $113,700 |
Source: Public Records
Map
Nearby Homes