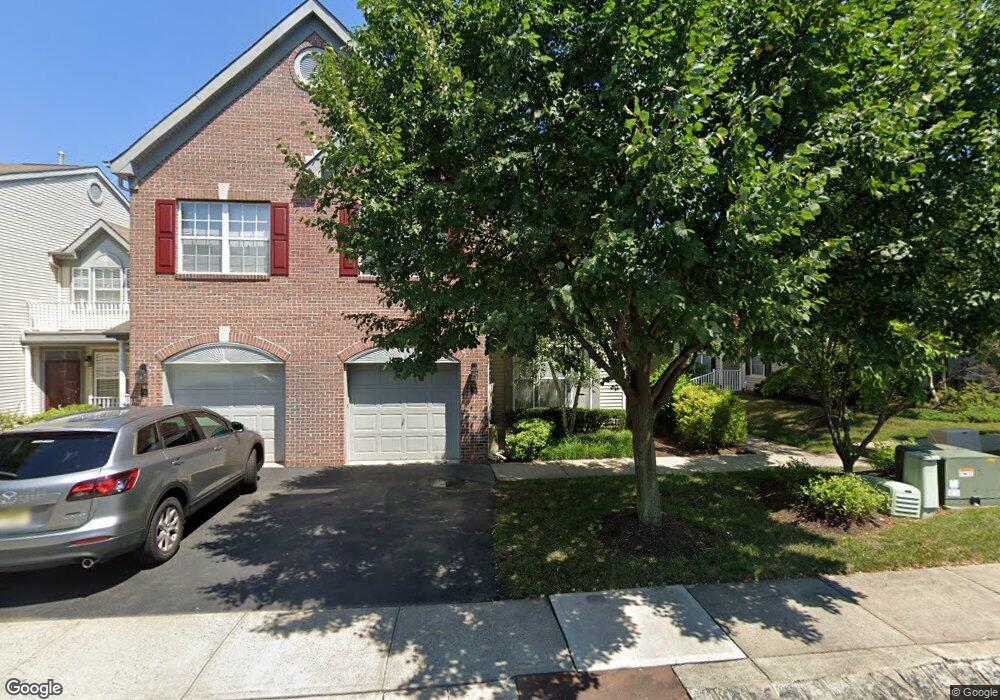
79 Banyan Blvd Holmdel, NJ 07733
Estimated Value: $665,000 - $759,000
3
Beds
3
Baths
2,145
Sq Ft
$325/Sq Ft
Est. Value
About This Home
This home is located at 79 Banyan Blvd, Holmdel, NJ 07733 and is currently estimated at $697,195, approximately $325 per square foot. 79 Banyan Blvd is a home located in Monmouth County with nearby schools including Village School, Indian Hill Elementary School, and William Satz Intermediate School.
Ownership History
Date
Name
Owned For
Owner Type
Purchase Details
Closed on
Jan 23, 2024
Sold by
Dektor Svetlana
Bought by
Dektor Ilona
Current Estimated Value
Purchase Details
Closed on
Aug 23, 2018
Sold by
Campione Rose Cheryl
Bought by
Dektor Svetlana and Dektor Ilona
Purchase Details
Closed on
Jul 12, 2001
Sold by
Kapsalis Christo
Bought by
Mccabe Rose
Home Financials for this Owner
Home Financials are based on the most recent Mortgage that was taken out on this home.
Original Mortgage
$60,000
Interest Rate
7.18%
Purchase Details
Closed on
May 23, 2000
Sold by
Woods At Holmdel
Bought by
Kapsalis Christo and Paulsen Linda
Home Financials for this Owner
Home Financials are based on the most recent Mortgage that was taken out on this home.
Original Mortgage
$180,000
Interest Rate
8.1%
Create a Home Valuation Report for This Property
The Home Valuation Report is an in-depth analysis detailing your home's value as well as a comparison with similar homes in the area
Home Values in the Area
Average Home Value in this Area
Purchase History
| Date | Buyer | Sale Price | Title Company |
|---|---|---|---|
| Dektor Ilona | -- | None Listed On Document | |
| Dektor Svetlana | $479,900 | American Land Title | |
| Mccabe Rose | $310,000 | -- | |
| Kapsalis Christo | $257,990 | -- |
Source: Public Records
Mortgage History
| Date | Status | Borrower | Loan Amount |
|---|---|---|---|
| Previous Owner | Mccabe Rose | $60,000 | |
| Previous Owner | Kapsalis Christo | $180,000 |
Source: Public Records
Tax History Compared to Growth
Tax History
| Year | Tax Paid | Tax Assessment Tax Assessment Total Assessment is a certain percentage of the fair market value that is determined by local assessors to be the total taxable value of land and additions on the property. | Land | Improvement |
|---|---|---|---|---|
| 2025 | $9,193 | $615,700 | $325,000 | $290,700 |
| 2024 | $8,752 | $583,300 | $319,000 | $264,300 |
| 2023 | $8,752 | $537,900 | $290,000 | $247,900 |
| 2022 | $8,973 | $466,300 | $260,000 | $206,300 |
| 2021 | $8,973 | $447,300 | $250,000 | $197,300 |
| 2020 | $9,043 | $443,500 | $235,000 | $208,500 |
| 2019 | $8,952 | $441,200 | $225,000 | $216,200 |
| 2018 | $8,808 | $435,800 | $205,000 | $230,800 |
| 2017 | $8,556 | $421,700 | $185,000 | $236,700 |
| 2016 | $8,447 | $421,100 | $160,000 | $261,100 |
| 2015 | $7,796 | $390,000 | $150,000 | $240,000 |
| 2014 | $7,516 | $359,600 | $170,000 | $189,600 |
Source: Public Records
Map
Nearby Homes
- 343 Middlewood Rd
- 1305 Arose Ln
- 4 Pine Tree Terrace
- 8 Stagecoach Dr Unit 13
- 901 Palmer Ave
- 58 Agostina Dr Unit 250
- 64 Agostina Dr Unit 64
- 44 Devonshire Ct
- 22 Weller Place Unit 22
- 846 Palmer Ave
- 2 Ware Place
- 161 Cherry Tree Ln
- 64 Hawthorne Ave
- 123-125 Magnolia Ln
- 35 Violet Ct
- 7 Acker Dr
- 9 Boxwood Terrace
- 6 Ridge Dr
- 8 Leocadia Ct
- 4 Coral Place
- 78 Banyan Blvd
- 77 Banyan Blvd Unit 77
- 76 Banyan Blvd Unit 76
- 76 Banyan Blvd Unit N076
- 80 Banyan Blvd
- 75 Banyan Blvd
- 75 Banyan Blvd Unit N075
- 0 Nutmeg Ln
- 74 Banyan Blvd
- 68 Banyan Blvd
- 81 Banyan Blvd
- 81 Banyan Blvd Unit N081
- 69 Banyan Blvd Unit 69
- 70 Banyan Blvd
- 67 Banyan Blvd
- 71 Banyan Blvd
- 71 Banyan Blvd Unit N071
- 73 Banyan Blvd
- 82 Banyan Blvd
- 94 Banyan Blvd