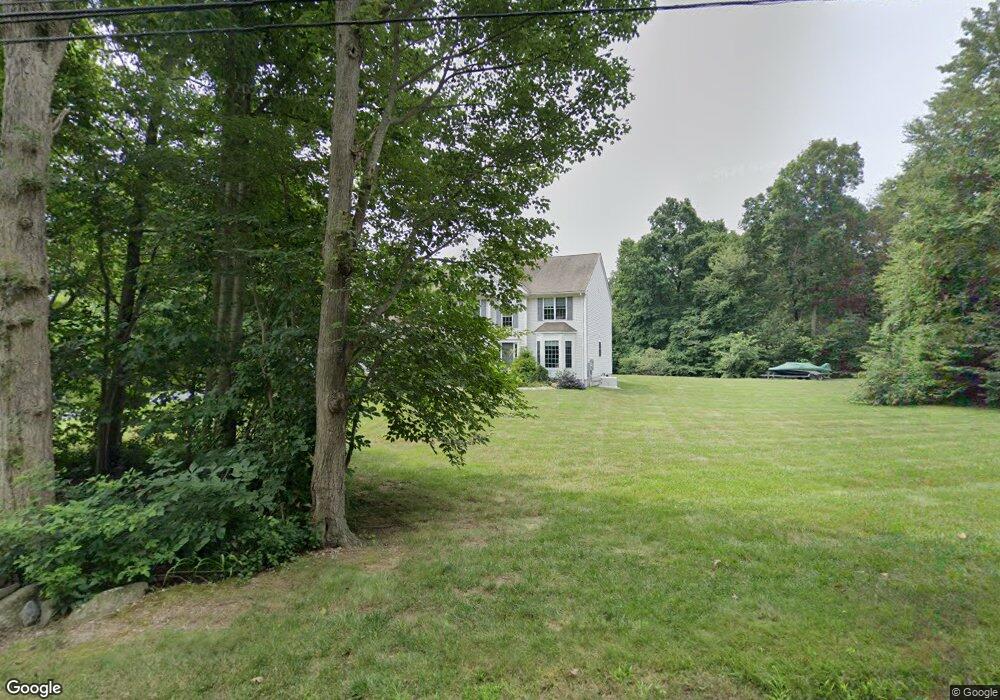
79 Bartman Rd Higganum, CT 06441
Estimated Value: $633,000 - $662,431
4
Beds
3
Baths
3,129
Sq Ft
$208/Sq Ft
Est. Value
About This Home
This home is located at 79 Bartman Rd, Higganum, CT 06441 and is currently estimated at $650,108, approximately $207 per square foot. 79 Bartman Rd is a home located in Middlesex County with nearby schools including Haddam-Killingworth High School and Haddam-Killingworth Intermediate School.
Ownership History
Date
Name
Owned For
Owner Type
Purchase Details
Closed on
Jul 18, 2023
Sold by
White Roni S
Bought by
Roni S White T S and Roni White
Current Estimated Value
Purchase Details
Closed on
Jun 8, 2017
Sold by
White Roni S and White Paul M
Bought by
White Roni S
Purchase Details
Closed on
May 31, 2005
Sold by
Pulte Homes New Englan
Bought by
White Roni and White Paul M
Home Financials for this Owner
Home Financials are based on the most recent Mortgage that was taken out on this home.
Original Mortgage
$346,560
Interest Rate
5.94%
Mortgage Type
Purchase Money Mortgage
Create a Home Valuation Report for This Property
The Home Valuation Report is an in-depth analysis detailing your home's value as well as a comparison with similar homes in the area
Home Values in the Area
Average Home Value in this Area
Purchase History
| Date | Buyer | Sale Price | Title Company |
|---|---|---|---|
| Roni S White T S | -- | None Available | |
| White Roni S | -- | -- | |
| White Roni | $433,200 | -- |
Source: Public Records
Mortgage History
| Date | Status | Borrower | Loan Amount |
|---|---|---|---|
| Previous Owner | White Roni | $361,000 | |
| Previous Owner | White Roni | $346,560 |
Source: Public Records
Tax History
| Year | Tax Paid | Tax Assessment Tax Assessment Total Assessment is a certain percentage of the fair market value that is determined by local assessors to be the total taxable value of land and additions on the property. | Land | Improvement |
|---|---|---|---|---|
| 2025 | $9,217 | $268,320 | $58,400 | $209,920 |
| 2024 | $9,217 | $268,320 | $58,400 | $209,920 |
| 2023 | $9,088 | $268,320 | $58,400 | $209,920 |
| 2022 | $8,675 | $268,320 | $58,400 | $209,920 |
| 2021 | $8,629 | $268,320 | $58,400 | $209,920 |
| 2020 | $8,540 | $269,480 | $66,840 | $202,640 |
| 2019 | $8,540 | $269,480 | $66,840 | $202,640 |
| 2018 | $8,422 | $265,760 | $66,840 | $198,920 |
| 2017 | $8,422 | $265,760 | $66,840 | $198,920 |
| 2016 | $8,292 | $265,760 | $66,840 | $198,920 |
| 2015 | $8,965 | $287,330 | $66,840 | $220,490 |
| 2014 | $8,876 | $287,330 | $66,840 | $220,490 |
Source: Public Records
Map
Nearby Homes
- 59 Hidden Lake Rd
- 37 Arkona Dr
- 0 S Dish Mill Rd Unit 24082788
- 672 Route 81
- 12 Jackson Rd
- 493 Candlewood Hill Rd
- 4 Hunters Ridge Rd
- 559 Route 81
- 25 Silver Springs Dr
- 579 Route 148
- 511 Route 81
- 0 Saybrook Rd
- 0 Swain Johnson Trail Unit 2
- 114 Walkley Hill Rd
- 214 Thayer Rd
- 794 Route 148
- 0 Plains Rd Unit 24163414
- 0 Turkey Hill Rd
- 15 Hazen St
- 74 Oxbow Rd
Your Personal Tour Guide
Ask me questions while you tour the home.