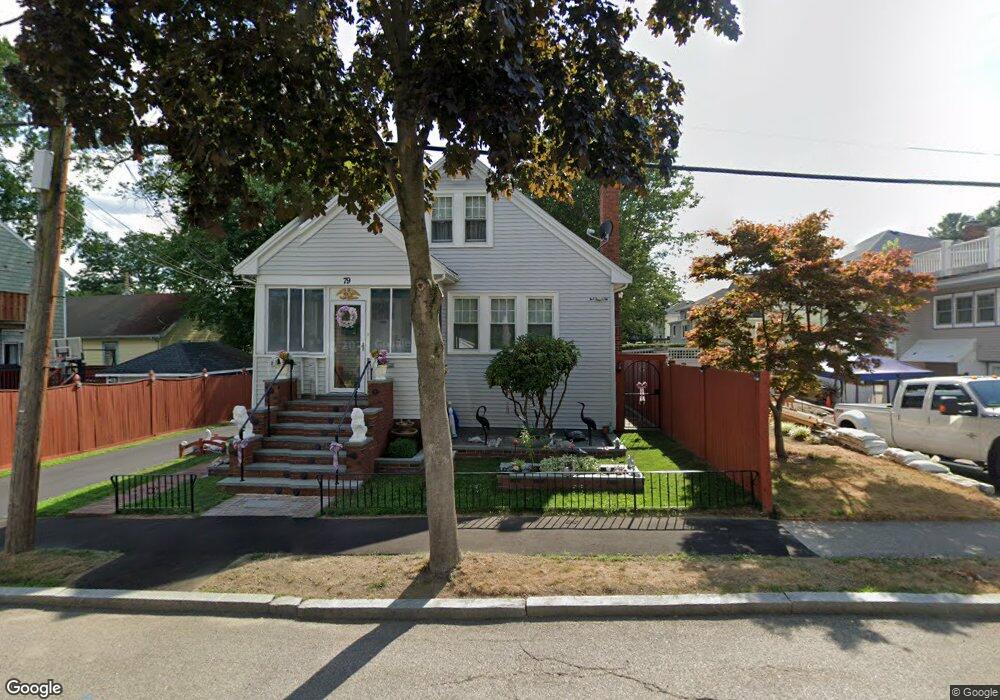
79 Bowdoin St Quincy, MA 02171
Montclair NeighborhoodEstimated Value: $904,000 - $1,146,000
5
Beds
3
Baths
2,300
Sq Ft
$432/Sq Ft
Est. Value
About This Home
This home is located at 79 Bowdoin St, Quincy, MA 02171 and is currently estimated at $993,044, approximately $431 per square foot. 79 Bowdoin St is a home located in Norfolk County with nearby schools including Montclair Elementary School, Atlantic Middle School, and North Quincy High School.
Ownership History
Date
Name
Owned For
Owner Type
Purchase Details
Closed on
Jun 16, 2017
Sold by
Tran My T
Bought by
79 Bowdoin Street Ret
Current Estimated Value
Purchase Details
Closed on
Sep 8, 2008
Sold by
Warren James H
Bought by
Tran My
Purchase Details
Closed on
Mar 18, 2005
Sold by
Owens Charles L and Owens Lorna A
Bought by
Warren James H and Tran My
Home Financials for this Owner
Home Financials are based on the most recent Mortgage that was taken out on this home.
Original Mortgage
$150,000
Interest Rate
5.64%
Mortgage Type
Purchase Money Mortgage
Create a Home Valuation Report for This Property
The Home Valuation Report is an in-depth analysis detailing your home's value as well as a comparison with similar homes in the area
Home Values in the Area
Average Home Value in this Area
Purchase History
| Date | Buyer | Sale Price | Title Company |
|---|---|---|---|
| 79 Bowdoin Street Ret | -- | -- | |
| Tran My | $56,346 | -- | |
| Warren James H | $450,000 | -- |
Source: Public Records
Mortgage History
| Date | Status | Borrower | Loan Amount |
|---|---|---|---|
| Previous Owner | Warren James H | $150,000 |
Source: Public Records
Tax History Compared to Growth
Tax History
| Year | Tax Paid | Tax Assessment Tax Assessment Total Assessment is a certain percentage of the fair market value that is determined by local assessors to be the total taxable value of land and additions on the property. | Land | Improvement |
|---|---|---|---|---|
| 2025 | $8,983 | $779,100 | $357,000 | $422,100 |
| 2024 | $8,707 | $772,600 | $357,000 | $415,600 |
| 2023 | $8,410 | $755,600 | $340,000 | $415,600 |
| 2022 | $8,200 | $684,500 | $295,700 | $388,800 |
| 2021 | $7,257 | $597,800 | $281,600 | $316,200 |
| 2020 | $7,432 | $597,900 | $281,600 | $316,300 |
| 2019 | $6,961 | $554,700 | $263,200 | $291,500 |
| 2018 | $7,005 | $525,100 | $243,700 | $281,400 |
| 2017 | $6,347 | $447,900 | $232,100 | $215,800 |
| 2016 | $5,776 | $402,200 | $201,800 | $200,400 |
| 2015 | $5,536 | $379,200 | $183,400 | $195,800 |
| 2014 | $4,886 | $328,800 | $174,700 | $154,100 |
Source: Public Records
Map
Nearby Homes
- 260 Elmwood Ave
- 444 W Squantum St
- 39 Fayette St Unit 102
- 115 W Squantum St Unit 810
- 115 W Squantum St Unit 907
- 204 Farrington St
- 143 Arlington St
- 182 Granite Ave
- 21 Linden St Unit 417
- 15 California Ave
- 511 Hancock St Unit 207
- 129 Beale St
- 522 Hancock St
- 225 S Central Ave
- 26 Buckingham Rd
- 83 Forbes Hill Rd
- 27 Shirley St
- 43 Ellington Rd
- 22 Beach St
- 150 Hancock St Unit 102
- 120 Hamilton Ave
- 124 Hamilton Ave
- 112 Hamilton Ave
- 217 Wilson Ave
- 128 Hamilton Ave
- 221 Wilson Ave
- 225 Wilson Ave
- 209 Wilson Ave
- 108 Hamilton Ave
- 132 Hamilton Ave
- 115 Hamilton Ave
- 229 Wilson Ave
- 106 Hamilton Ave
- 62 Bowdoin St
- 205 Wilson Ave
- 203 Wilson Ave
- 136 Hamilton Ave
- 119 Hamilton Ave
- 59 Bowdoin St
- 129 Hamilton Ave