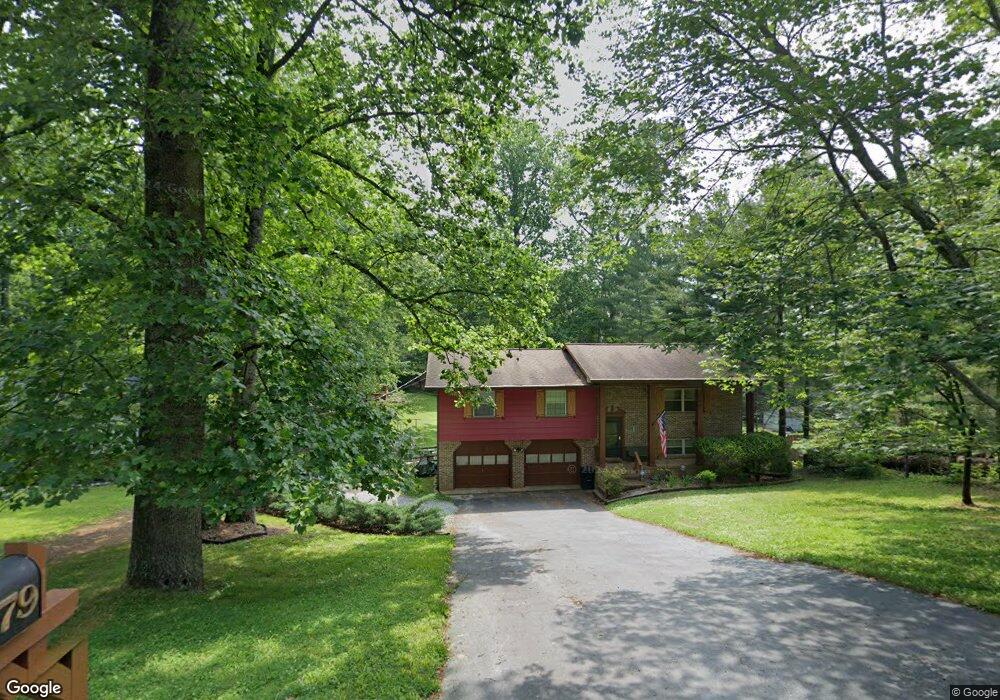
79 Brumby Rd Flintstone, GA 30725
Flintstone NeighborhoodEstimated Value: $241,248 - $296,000
3
Beds
2
Baths
2,000
Sq Ft
$133/Sq Ft
Est. Value
About This Home
This home is located at 79 Brumby Rd, Flintstone, GA 30725 and is currently estimated at $265,312, approximately $132 per square foot. 79 Brumby Rd is a home located in Walker County with nearby schools including Chattanooga Valley Elementary School, Chattanooga Valley Middle School, and Ridgeland High School.
Ownership History
Date
Name
Owned For
Owner Type
Purchase Details
Closed on
Jan 2, 2002
Sold by
Keller Robert A
Bought by
Keller Robert A and Keller Sandra M
Current Estimated Value
Purchase Details
Closed on
Jun 30, 1999
Sold by
Ware Thomas C and Ware Denise A
Bought by
Keller Robert A
Purchase Details
Closed on
Nov 22, 1991
Sold by
Martin Charles C and Martin Doris J
Bought by
Ware Thomas C and Ware Denise A
Purchase Details
Closed on
Mar 26, 1984
Sold by
Forrester David N and Forrester Cathy
Bought by
Martin Charles C and Martin Doris J
Purchase Details
Closed on
Apr 21, 1978
Sold by
Forrester Garnett L
Bought by
Forrester David N and Forrester Cathy
Purchase Details
Closed on
Aug 1, 1977
Sold by
Bates Joedy and Bates Betty
Bought by
Forrester Garnett L
Purchase Details
Closed on
Jan 6, 1972
Bought by
Bates Joedy and Bates Betty
Create a Home Valuation Report for This Property
The Home Valuation Report is an in-depth analysis detailing your home's value as well as a comparison with similar homes in the area
Home Values in the Area
Average Home Value in this Area
Purchase History
| Date | Buyer | Sale Price | Title Company |
|---|---|---|---|
| Keller Robert A | -- | -- | |
| Keller Robert A | $85,100 | -- | |
| Ware Thomas C | $69,500 | -- | |
| Martin Charles C | $55,000 | -- | |
| Forrester David N | -- | -- | |
| Forrester Garnett L | -- | -- | |
| Bates Joedy | -- | -- |
Source: Public Records
Tax History
| Year | Tax Paid | Tax Assessment Tax Assessment Total Assessment is a certain percentage of the fair market value that is determined by local assessors to be the total taxable value of land and additions on the property. | Land | Improvement |
|---|---|---|---|---|
| 2024 | $1,428 | $60,272 | $14,040 | $46,232 |
| 2023 | $1,399 | $57,730 | $14,040 | $43,690 |
| 2022 | $1,321 | $51,334 | $14,040 | $37,294 |
| 2021 | $1,199 | $41,810 | $11,700 | $30,110 |
| 2020 | $1,181 | $39,689 | $11,700 | $27,989 |
| 2019 | $1,200 | $39,648 | $11,700 | $27,948 |
| 2018 | $1,049 | $39,648 | $11,700 | $27,948 |
| 2017 | $1,236 | $37,200 | $11,700 | $25,500 |
| 2016 | $991 | $37,200 | $11,700 | $25,500 |
| 2015 | $1,334 | $48,207 | $4,800 | $43,407 |
| 2014 | $1,231 | $48,207 | $4,800 | $43,407 |
| 2013 | -- | $48,207 | $4,800 | $43,407 |
Source: Public Records
Map
Nearby Homes
- 33 Brumby Rd
- 152 Carmack Rd
- 19 Turkey Run
- 22 Carmack Rd
- 16 Japonica St
- 120 Williams Ave
- 102 W Schmitt Rd
- 2255 Nick-A Jack Rd
- 1854 Powder Springs Cir
- 309 W Schmitt Rd
- 404 W Schmitt Rd
- 196 North Ave
- 115 Crestline Dr
- 211 Elaine Dr
- 86 West Dr
- 221 Highland Dr
- 52 Tower Dr
- 130 Cascade Dr
- 125 Cascade Dr
- 270 Cascade Dr
Your Personal Tour Guide
Ask me questions while you tour the home.