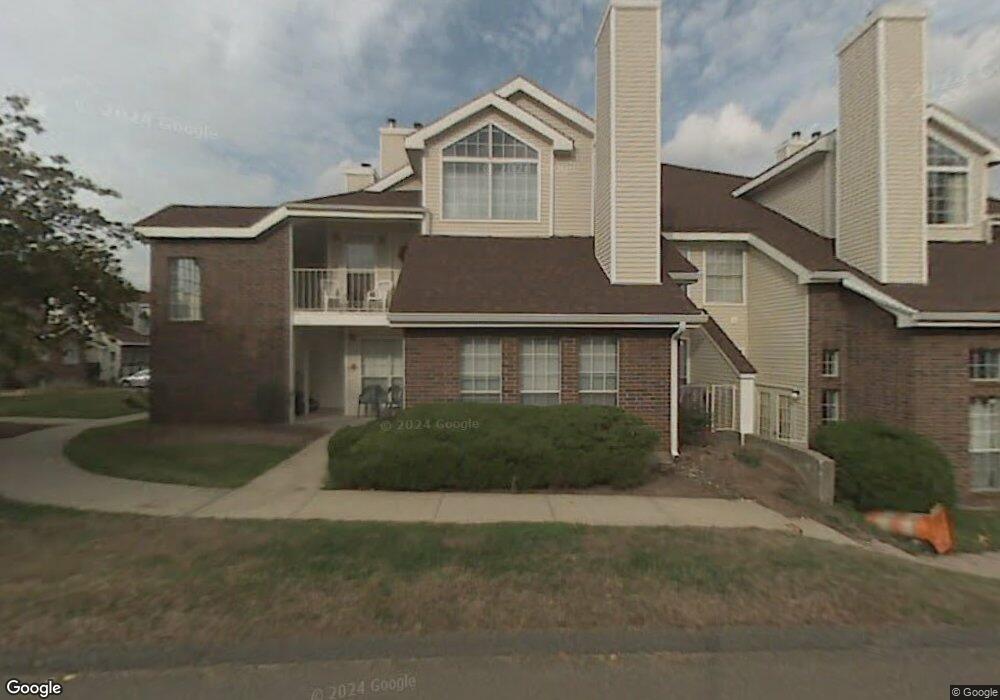
79 Carriage Crossing Ln Middletown, CT 06457
Westfield NeighborhoodEstimated Value: $127,191 - $179,000
1
Bed
1
Bath
670
Sq Ft
$242/Sq Ft
Est. Value
About This Home
This home is located at 79 Carriage Crossing Ln, Middletown, CT 06457 and is currently estimated at $162,048, approximately $241 per square foot. 79 Carriage Crossing Ln is a home located in Middlesex County with nearby schools including Moody School.
Ownership History
Date
Name
Owned For
Owner Type
Purchase Details
Closed on
Mar 27, 2018
Sold by
Harrington Sarah E
Bought by
Marotta Andrew
Current Estimated Value
Purchase Details
Closed on
Sep 29, 2009
Sold by
Thesen Ashley N
Bought by
Gomes Sarah E
Home Financials for this Owner
Home Financials are based on the most recent Mortgage that was taken out on this home.
Original Mortgage
$86,400
Interest Rate
5.06%
Purchase Details
Closed on
Jul 9, 2007
Sold by
Sheahan Colleen
Bought by
Thesen Ashley N
Home Financials for this Owner
Home Financials are based on the most recent Mortgage that was taken out on this home.
Original Mortgage
$116,725
Interest Rate
6.39%
Purchase Details
Closed on
Oct 31, 2003
Sold by
Parenteau Robin M
Bought by
Sheahan Colleen
Home Financials for this Owner
Home Financials are based on the most recent Mortgage that was taken out on this home.
Original Mortgage
$56,000
Interest Rate
6.05%
Create a Home Valuation Report for This Property
The Home Valuation Report is an in-depth analysis detailing your home's value as well as a comparison with similar homes in the area
Home Values in the Area
Average Home Value in this Area
Purchase History
| Date | Buyer | Sale Price | Title Company |
|---|---|---|---|
| Marotta Andrew | $78,000 | -- | |
| Gomes Sarah E | $108,000 | -- | |
| Thesen Ashley N | $125,000 | -- | |
| Sheahan Colleen | $87,000 | -- |
Source: Public Records
Mortgage History
| Date | Status | Borrower | Loan Amount |
|---|---|---|---|
| Previous Owner | Sheahan Colleen | $86,400 | |
| Previous Owner | Sheahan Colleen | $86,400 | |
| Previous Owner | Sheahan Colleen | $116,725 | |
| Previous Owner | Sheahan Colleen | $56,000 |
Source: Public Records
Tax History Compared to Growth
Tax History
| Year | Tax Paid | Tax Assessment Tax Assessment Total Assessment is a certain percentage of the fair market value that is determined by local assessors to be the total taxable value of land and additions on the property. | Land | Improvement |
|---|---|---|---|---|
| 2025 | $2,176 | $64,600 | $0 | $64,600 |
| 2024 | $2,063 | $64,600 | $0 | $64,600 |
| 2023 | $1,941 | $64,600 | $0 | $64,600 |
| 2022 | $1,737 | $46,290 | $0 | $46,290 |
| 2021 | $1,732 | $46,290 | $0 | $46,290 |
| 2020 | $1,735 | $46,290 | $0 | $46,290 |
| 2019 | $1,744 | $46,290 | $0 | $46,290 |
| 2018 | $1,682 | $46,290 | $0 | $46,290 |
| 2017 | $2,220 | $62,620 | $0 | $62,620 |
| 2016 | $2,177 | $62,620 | $0 | $62,620 |
| 2015 | $2,130 | $62,620 | $0 | $62,620 |
| 2014 | $2,131 | $62,620 | $0 | $62,620 |
Source: Public Records
Map
Nearby Homes
- 130 Carriage Crossing Ln Unit 130
- 48 Carriage Crossing Ln Unit 8108
- 7 W Meadow Ln Unit 5
- 67 Braeburn Ln
- 7 Inverness Square
- 59 Inverness Ln
- 59 Fieldbrook Rd
- 886 East St
- 14 Rising Trail Dr
- 52 Rising Trail Dr
- 36 Rising Trail Dr Unit 36
- 100 Rising Trail Dr Unit 100
- 162 Rising Trail Dr
- 17 Flynn Ln
- 123 Burgundy Hill Ln
- 36 Burgundy Hill Ln
- 48 Burgundy Hill Ln Unit 48
- 56 Burgundy Hill Ln Unit 56
- 38 Burgundy Hill Ln
- 229 Burgundy Hill Ln Unit 229
- 119 Carriage Crossing Ln
- 317 Carriage Crossing Ln
- 274 Carriage Crossing Ln
- 35 Carriage Crossing Ln
- 110 Carriage Crossing Ln
- 131 Carriage Crossing Ln
- 235 Carriage Crossing Ln
- 43 Carriage Crossing Ln
- 264 Carriage Crossing Ln
- 100 Carriage Crossing Ln
- 47 Carriage Crossing Ln
- 237 Carriage Crossing Ln
- 70 Carriage Crossing Ln
- 60 Carriage Crossing Ln
- 116 Carriage Crossing Ln
- 127 Carriage Crossing Ln
- 114 Carriage Crossing Ln
- 280 Carriage Crossing Ln
- 74 Carriage Crossing Ln
- 90 Carriage Crossing Ln